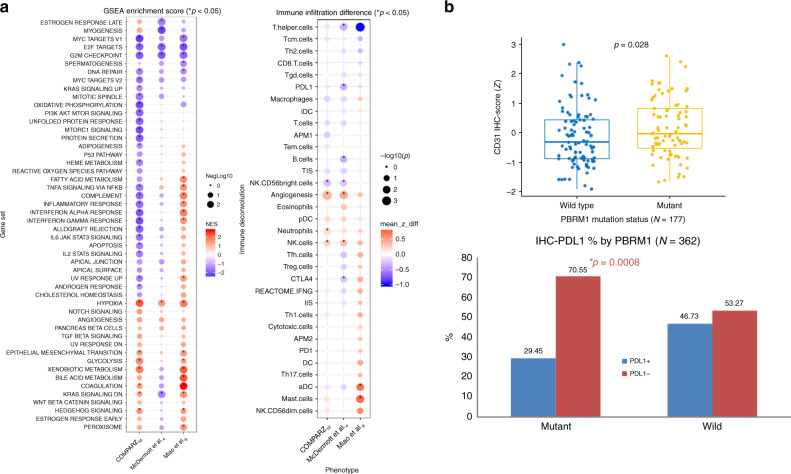
Fig. 7. Immune deconvolution of PBRM1 mutated tumors.
a Immune deconvolution using single sample gene set enrichment analysis (GSEA), focusing on immune and angiogenic gene signatures. Significantly higher angiogenic gene expression was observed in PBRM1 mutated tumors in the COMPARZ16 and McDermott et al.4 data sets, p = 0.0004 and 0.005, respectively, and a similar trend in the Miao et al.8 cohort. b Immunohistochemistry staining results from COMPARZ16 and McDermott et al.4 data sets demonstrate significantly higher CD31+ staining in PBRM1 mutated tumors and lower PD-L1+ staining in PBRM1 mutated tumors. Box plot: middle line of box indicates median and the bounds indicate quartile 1 and quartile 3. The whiskers reach to the maximum/minimum point within the 1.5 × interquartile range from quartile 3/quartile 1, respectively. P values from COMPARZ16 bar plots generated by Fisher’s exact test; p values from the GSEA plot derived from a permutation test; p values from immune deconvolution difference plot and box plots derived from Wilcoxon rank-sum test. The Fisher’s Exact test and Wilcoxon rank-sum test p values are two sided. No adjustments made for multiple comparisons; all p values are nominal.

