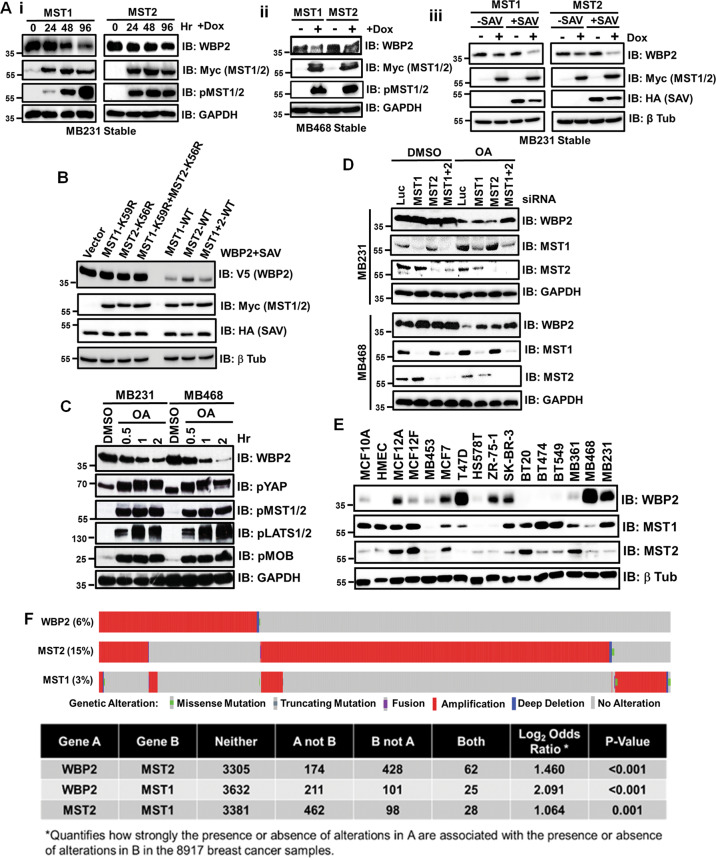
Fig. 2. MST Inhibition of WBP2 is Kinase-dependent and Enhanced by SAV.
a MST1 or MST2 overexpression downregulates endogenous WBP2 protein level in the temporal-dependent manner in MDA-MB-231 and MDA-MB468. MDA-MB-231 (i) or MDA-MB-468 T-Rex cells (ii) stably infected with MST1 or MST2 was induced with doxycycline for various time courses (0–72h). The total cell lysates were examined by western blot. (iii) SAV potentiated MST1/2-mediated downregulation of WBP2 in MDA-MB-231. Stable MDA-MB-231 T-Rex cells stably infected with MST1 or MST2 was transiently transfected with vector or pCI-Neo-SAV, followed by 48h doxycycline induction. The total cell lysates were then examined by western blot. b MST1/2 downregulates WBP2 protein expression in the kinase activity-dependent manner in HeLa. HeLa cells were transiently transfected with pCDNA6.2-WBP2 and pCI-Neo-SAV together with vector, wild-type (WT) or kinase-dead (MST1-K59R, MST2-K56R) pCI-Neo-MST1 and/or MST2 kinases downregulated WBP2 expression in HeLa. Twenty-four hours after transfection, the total cell lysates were examined by western blot. c Activation of MST1/2 and LATS1/2 kinases via okadaic acid (OA) induced temporal-dependent WBP2 downregulation in MDA-MB-231 and MDA-MB-468. MDA-MB-231 and MDA-MB-468 cells were treated with vehicle control (DMSO) or OA for various time courses (0–2h). The total cell lysates were then examined by western blot. d MST1/2 knockdown significantly abolished OA-induced WBP2 downregulation in MDA-MB-231 and MDA-MB-468. MDA-MB-231 and MDA-MB-468 cells were transiently transfected with luciferase or MST1+2 siRNAs. Forty-eight hours after transfection, the cells were treated with vehicle control (DMSO) or OA for 2h. The total cell lysates were then examined by western blot. e Immunoblot analysis of WBP2 and MST1 or MST2 protein expression in vitro in a panel of breast cancer cell lines. f In silico association analysis between the genomic alterations of WBP2, MST1 or MST2, in clinical breast cancers. The map demonstrates the inverse alteration pattern of WBP2 and MST1/2 genes in individual cancer patients. The figure was generated based on the patients’ genomic data analysis by cBioPortal tool obtained from 8917 heterogeneous patients selected from 10 studies including Breast Cancer (METABRIC, Nature 2012 & Nat Commun 2016), Breast Invasive Carcinoma (Broad, Nature 2012), Breast Invasive Carcinoma (Sanger, Nature 2012), Breast Invasive Carcinoma (TCGA, Cell 2015), Breast Invasive Carcinoma (TCGA, Firehose Legacy), Breast Invasive Carcinoma (TCGA, Nature 2012), Breast Invasive Carcinoma (TCGA, PanCancer Atlas), Metastatic Breast Cancer (INSERM, PLoS Med 2016) and The Metastatic Breast Cancer Project (Provisional, February 2020). The continuous bar is made up of individual columns representing the status of gene alteration in individual patients. % refers to frequency of gene alteration in the studied population of breast cancer clinical samples.

