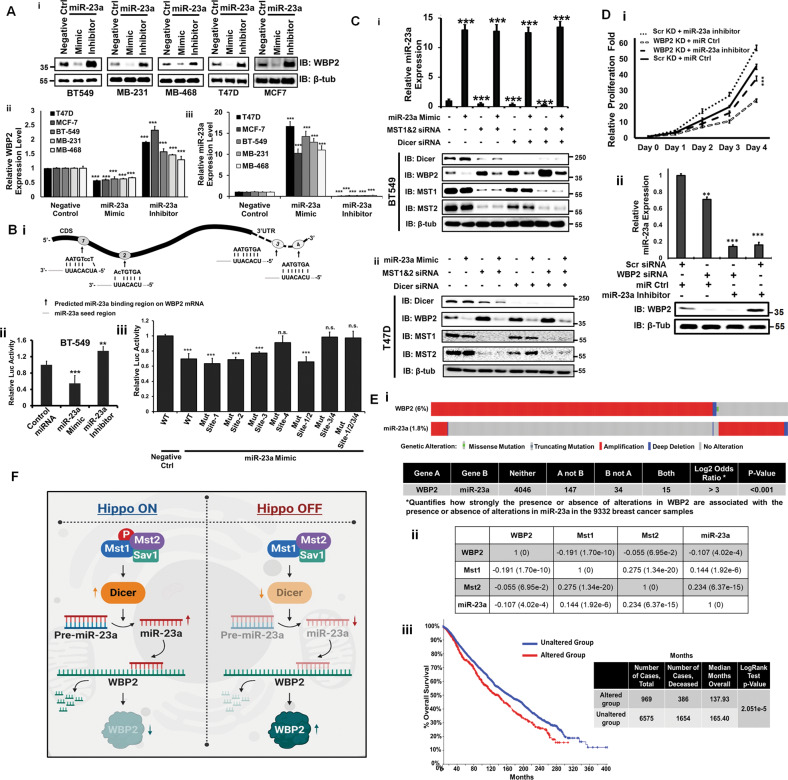
Fig. 6. miRNA-23a Directly Targets WBP2 3′UTR and Their Expression Levels are Inversely Correlated in Clinical Breast Cancer Patients.
a The miR-23a mimic and inhibitor downregulates and upregulates the endogenous WBP2 protein expression respectively in multiple breast cancer cells. The MCF7, T47D, BT549, MDA-MB-231, and MDA-MB-468 cells were transiently transfected with mimics and inhibitors of miR-23a. Forty-eight hours post-transfection, endogenous WBP2 protein (i) and mRNA (ii) expression as well as QC of miR-23a expression (iii) was examined via western blot and qPCR. b (i) Potential target sites of miR-23a in the CDS and 3′-UTR regions of WBP2 mRNA. (ii) BT-549 cells were transfected with psiCheck2-WBP2 mRNA (CDS+3′UTR) in the presence of miR-23a mimic and inhibitor. After 24h, cells were lysed and renilla/firefly luciferase activity was measured. (iii) Mapping of the binding site for the miR-23a-WBP2 interaction using the WT and various mutants of Site-1 to 4 via renilla/firefly dual luciferase assay. c Overexpression of miR-23a abolished the MST1/2 and/or Dicer siRNA knockdown-induced upregulation of WBP2 protein expression in (i) BT549 and (ii) T47D. BT549 and T47D cells were transiently transfected with luciferase, MST1&2 and/or Dicer siRNAs in the presence of miRNA control or miR-23a mimic. Forty-eight hours post-transfection, the total lysates and QC of miR-23a expression were examined by western blot and qPCR respectively. d (i) WBP2 siRNA knockdown rescued the miR-23a inhibitor-induced cell proliferation of BT549. BT549 cells were transiently transfected with scramble or WBP2 siRNAs and miR control or inhibitor for 48h before being seeded for quantitative measurement of cell proliferation over 4 days via MTS assay (ii) miR-23a and WBP2 expression were verified by qPCR and western blot, respectively. e (i) In silico association analysis between the genomic alterations of WBP2 and miR-23a in clinical breast cancers. The map demonstrates the inverse alteration pattern of WBP2 and miR-23a genes in individual cancer patients. The figure was generated based on the patients’ genomic data analysis by cBioPortal tool obtained from 8917 heterogeneous patients selected from 10 studies including Breast Cancer (METABRIC, Nature 2012 & Nat Commun 2016), Breast Invasive Carcinoma (Broad, Nature 2012), Breast Invasive Carcinoma (Sanger, Nature 2012), Breast Invasive Carcinoma (TCGA, Cell 2015), Breast Invasive Carcinoma (TCGA, Firehose Legacy), Breast Invasive Carcinoma (TCGA, Nature 2012), Breast Invasive Carcinoma (TCGA, PanCancer Atlas), Metastatic Breast Cancer (INSERM, PLoS Med 2016) and The Metastatic Breast Cancer Project (Provisional, February 2020). The continuous bar is made of individual columns representing the status of gene alteration in individual patients. % refers to frequency of gene alteration in the studied population of breast cancer clinical samples. (ii) Correlational analysis among the mRNA levels of MST1/2-miR-23-WBP2 signature components in breast invasive carcinoma cases obtained from ENCORI database. Data are shown as r (p-value), Pearson correlation test. (iii) Survival analysis of MST1/2, miR-23a, and WBP2 genes using cBioPortal database. f A schematic representation of the pathway showing MST-Dicer-miR-23a mediated WBP2 downregulation.

