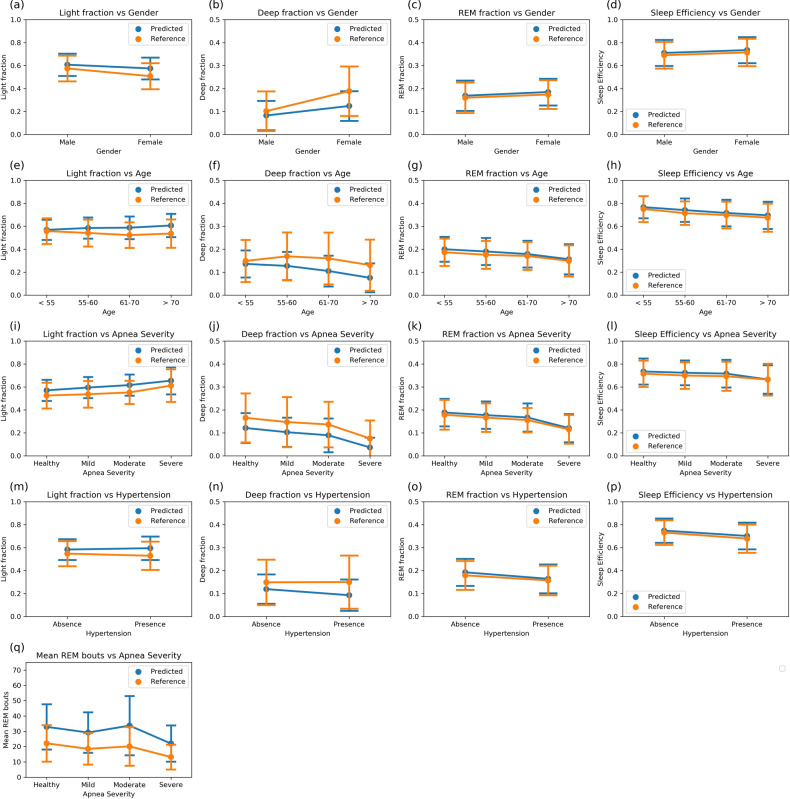
Fig. 5. Distributions of sleep metrics derived from PSG reference and model predicted stages.
The test population is split into groups by the clinical measures marked in the x-axis. The y-axis shows the values of sleep metrics—points represent the mean value of the metrics and the bars represent the standard deviations. The distributions calculated using the PSG reference stages and the algorithmically predicted stages show excellent concordance for fraction of REM during sleep and sleep efficiency. Deep sleep is underestimated by our model in favor of light sleep, yet the qualitative effect of clinical states on light and deep fractions is consistent between reference and predicted stages. a–d stage fractions and sleep efficiency with gender. N = 360, 440. e–h stage fractions and sleep efficiency with age. N = 164, 168, 198, 270. i–l stage fractions and sleep efficiency with apnea severity. N = 364, 314, 65, 57. m–p stage fractions and sleep efficiency with presence of hypertension. N = 436, 364. q mean REM bout lengths with apnea severity. The mean REM bout durations calculated from algorithmically predicted stages are higher than the PSG reference stages because the predicted stages are “smoother”, i.e., contain fewer stage bouts that last only 1 or 2 epochs interrupting larger stage bouts. Despite this effect, the increase in REM instability seen in apneic subjects is evident. N = 364, 314, 65, 57.

