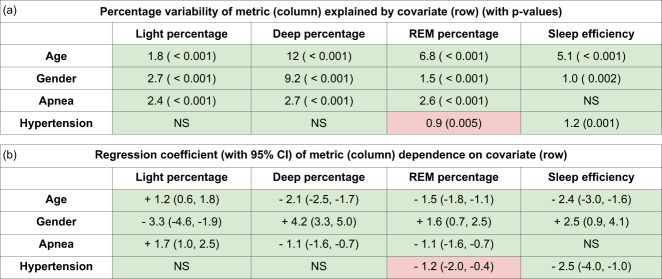
Fig. 6. Sleep covariate regression analysis.
The tables below show results of regression analysis with the covariates on each row as independent variables and our algorithm predicted sleep metrics on each column as the dependent variable. The metrics are adjusted for age and gender before regressing on apnea, and adjusted for age, gender and apnea before regressing on hypertension. Boxes where the covariate was a significant predictor are filled with values, the rest are filled with “NS”. Boxes colored in green are those where our results qualitatively agree with a previous study12 done using on PSG reference stages. Boxes colored in red are those where the previous study12 and our results disagree. N = 800. a Regression coefficients with 95% confidence intervals. b Percentage of variance of sleep measure explained by covariate calculated as 100 * R-squared along with p-values.

