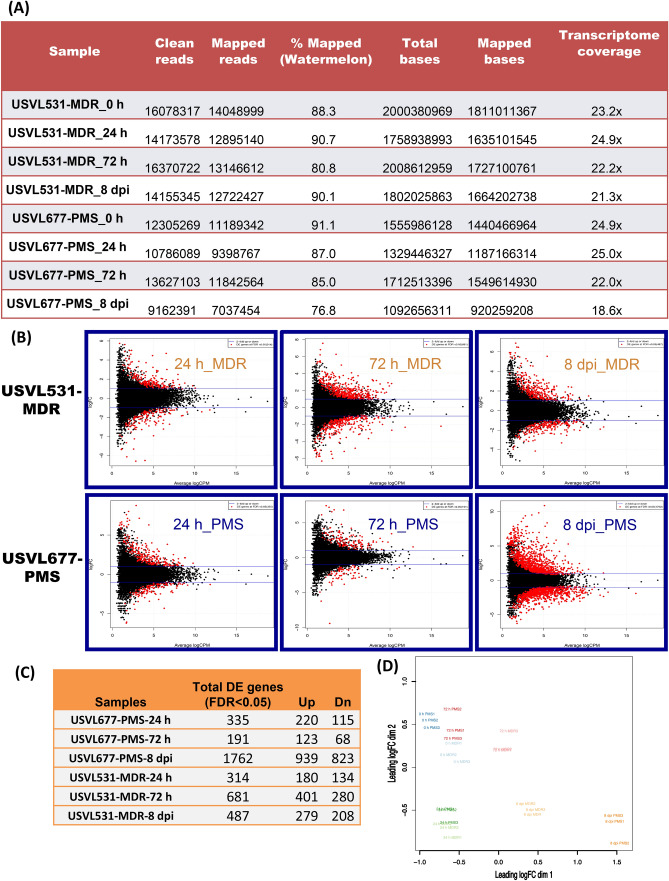
Figure 3.
Processed RNA-seq data. (A) Total number of clean, mapped reads (watermelon) and bases of each mRNAseq sample (three replicates) following PM inoculation collected from watermelon lines: USVL677-PMS & USVL531-MDR at 0 h, 24 h, 72 h and 8 dpi. (B) Distribution of differentially expressed genes (DEGs) for each mRNAseq sample following PM inoculation collected from watermelon lines: USVL677-PMS & USVL531-MDR at 0 h, 24 h, 72 h and 8 dpi. The DEGs are shown in red logFC > 1, P value < 0.05 and FDR ratio of < 0.05 for each gene in each pair-wise comparison of each time points with uninoculated 0 h as control. The red dots highlight transcripts of positive and negative values of log2 Fold Change (logFC), indicating that the sequences were upregulated and downregulated at each time point. The black dots indicate non-differentially expressed genes. The genes names, fold changes, and p values, FDR values for up- and down-regulated DEGs were listed in Table S1. (C) Table showing total DEGs, upregulated and downregulated genes in response to PM in USVL677-PMS & USVL531-MDR at 24 h, 72 h and 8 dpi. (D) Multidimensional scaling (MDS) of all replicate samples.

