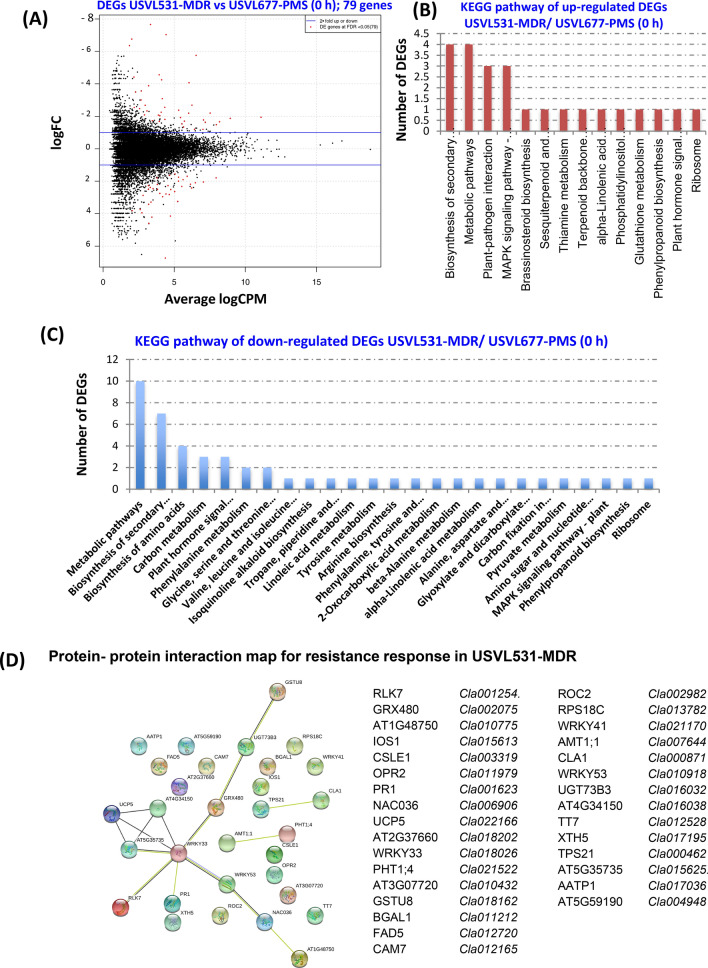
Figure 9.
Expression profile and KEGG enrichment analysis of DEGs in Multiple Disease Resistance Line (MDR) as compared to PM susceptible line (PMS) at 0 h. (A) Scatter plot of DEGs USVL531-MDR (0 h) vs USVL677-PMS (0 h); 79 genes. The red dots highlight transcripts of positive and negative values of log2 Fold Change (logFC), (B) KEGG pathway of up-regulated DEGs USVL531-MDR/ USVL677-PMS (0 h) (C) KEGG pathway of down-regulated DEGs USVL531-MDR/ USVL677-PMS (0 h) (D) Protein- protein interaction map for resistance response in USVL531-MDR.

