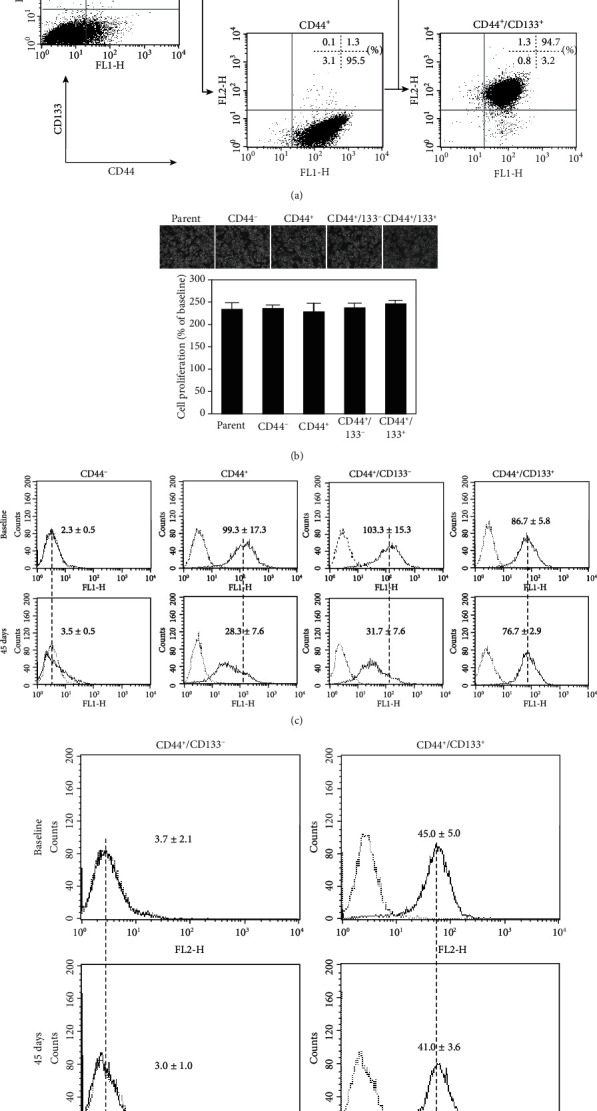
Figure 1.

The separation of HCT8 colorectal cancer cells into different subpopulations based on the expression of CD44 and CD133. (a) Representative dot plots of flow cytometry analysis show the purities of each subpopulation of isolated cells. Quantitative data in the dot plots are presented as the percentages of positive cells from three independent experiments. (b) Representative photos of morphological properties (upper) and MTT assay on cell growth (lower) at 24 hr after the initiation of culture. Data are presented as the mean ± SD from three independent experiments. (c, d) Representative histograms of flow cytometry analysis showed the expressions of CD44 (c) and CD133 (d) at baseline and 45 days after cell culture. The dotted vertical lines through histograms indicate the difference in the expression peaks between the baseline and at 45 days after culture. Quantitative data in the histograms are presented as the mean fluorescent intensity from three independent experiments.
