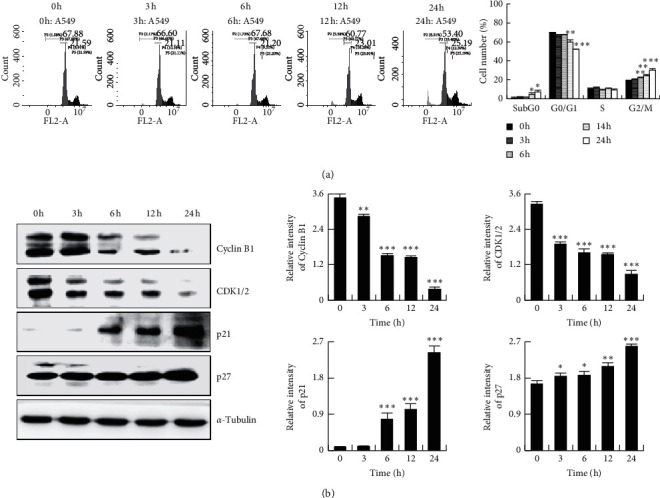
Figure 3.

Effects of HHDMNQ treatment (3, 6, 12, and 24 h) on the A549 cell cycle. (a) Cells were stained with PI, and the cell cycle distribution was determined by flow cytometry and quantitative cell cycle analysis. (b) The expression levels of CDK1/2, cyclin B1, p21, and p27 proteins were analyzed by western blot and quantitative histograms of proteins (∗p < 0.05, ∗∗p < 0.01, ∗∗∗p < 0.001).
