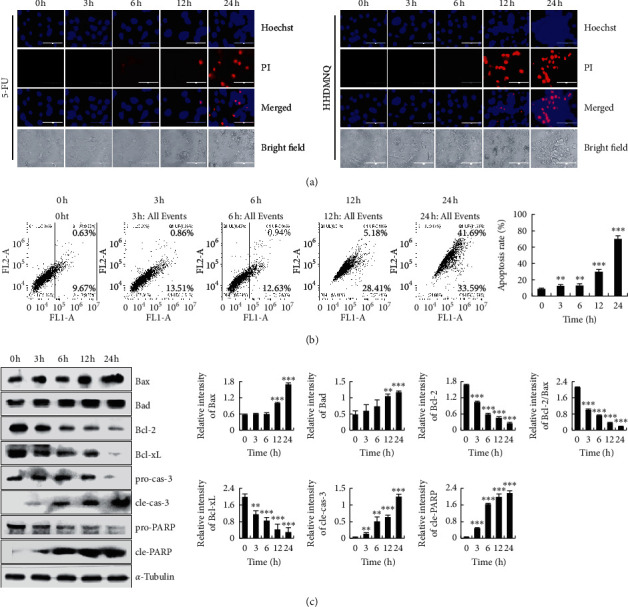
Figure 4.

Effects of HHDMNQ on the morphological changes, apoptosis rate, and intrinsic apoptosis pathway in A549 cells. (a) A549 cells treated with 6 μM 5-FU or HHDMNQ for 3, 6, 12, and 24 h fluorescence microscopic images (magnification, 200×) and relative fluorescence intensity. (b) Apoptosis distribution of A549 cells was determined by Annexin V-FITC/PI staining and quantification of early and late apoptotic cells. (c) A549 cells treated with 6 μM HHDMNQ for 3, 6, 12, and 24 h. Expression levels of Bax, Bad, Bcl-2, Bcl-xL, pro-caspase-3, cleaved caspase-3, pro-PARP, cleaved PARP, and Bcl-2/Bax ratio were analyzed by western blot and quantitative histograms of proteins (∗p < 0.05, ∗∗p < 0.01, ∗∗∗p < 0.001).
