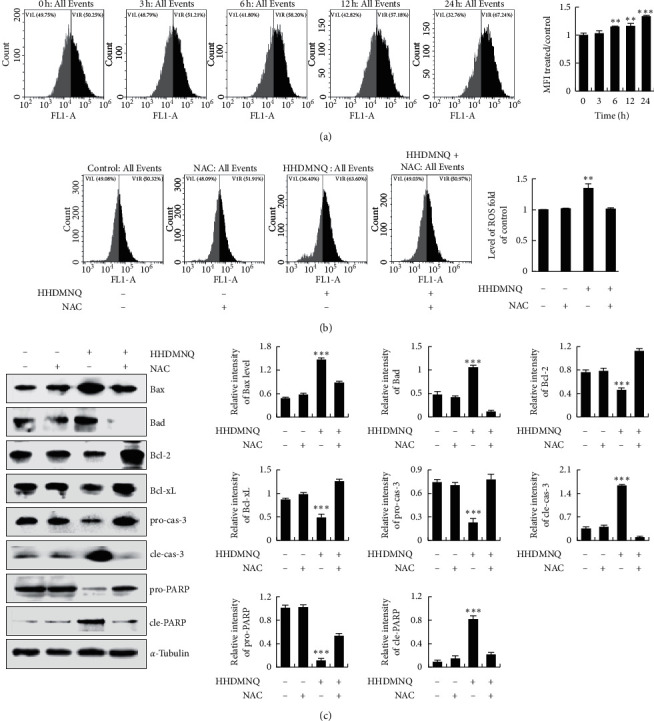
Figure 6.

Effects of HHDMNQ on intracellular ROS levels and mitochondrial pathways in A549 cells. (a) A549 cells treated with 6 μM HHDMNQ for 3, 6, 12, and 24 h, and intracellular ROS levels were measured by flow cytometry and quantification histograms of intracellular ROS levels. (b) A549 cells treated with or without NAC for 24 h, and intracellular ROS levels were measured by flow cytometry and quantification histograms of intracellular ROS levels. (c) A549 cells treated with or without NAC for 24 h; expression levels of Bax, Bad, Bcl-2, Bcl-xL, caspase-3, and PARP were measured by western blot and quantitative histograms of proteins (∗p < 0.05, ∗∗p < 0.01, ∗∗∗p < 0.001).
