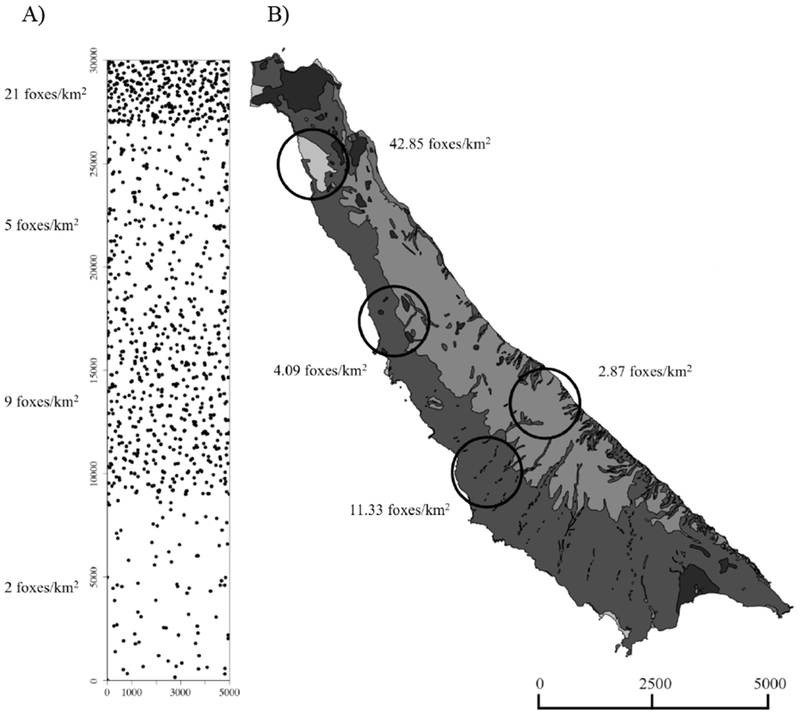
Figure 1.

Maps of San Clemente Island (SCI) illustrating the distribution of fox densities. SCI depicted by the disease model (A), with dots representing the simulated home range center of each fox. Habitat map of SCI with circles marking study sites (B) where foxes were fitted with proximity collars to estimate model parameters (Sanchez and Hudgens 2015). Scales are in meters.
