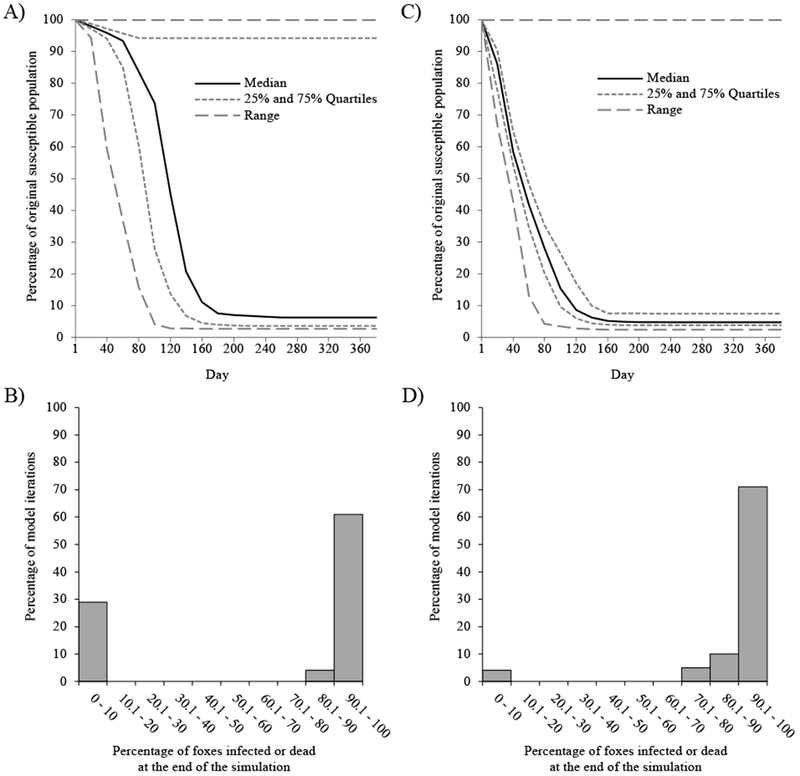
Figure 3.

Model simulation results of canine distemper virus (CDV) introduction to areas of San Clemente Island with low (A, B) or high (C, D) fox density. Line graphs show the percentage of the original susceptible fox population remaining uninfected during each day of the simulation after CDV was introduced into an area of the island with low (A) or high (C) fox density. Histograms show the percentage of model iterations that resulted in a given percentage of the original susceptible fox population being infected or dead at the end of the one-year simulation when CDV was introduced to an area of low (B) or high (D) fox density, demonstrating the variability of epidemic severity.
