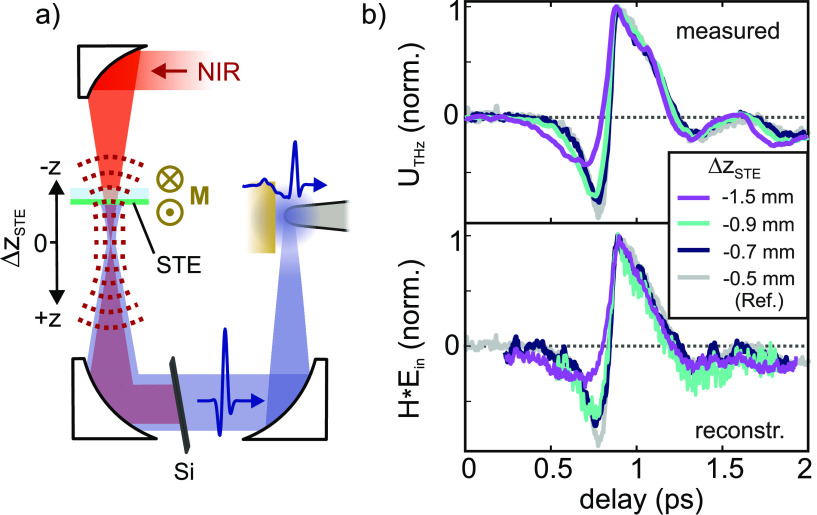
Figure 3.
(a) Curved-wavefront excitation geometry with varying positions ΔzSTE of the STE through the convergent NIR pump beam. (b) THz waveforms for various values ΔzSTE close to the NIR focus. The waveforms measured in the STM (top panel) are reproduced by the waveforms obtained from inverse Fourier transformation (bottom panel) of the product of the measured tip transfer function H(ω) (Figure 2d) and the respective incident THz spectra (shown in the Supporting Information). The light gray curve shows the reference waveform from Figure 2 used to obtain H(ω). All other settings are the same as in Figure 2.

