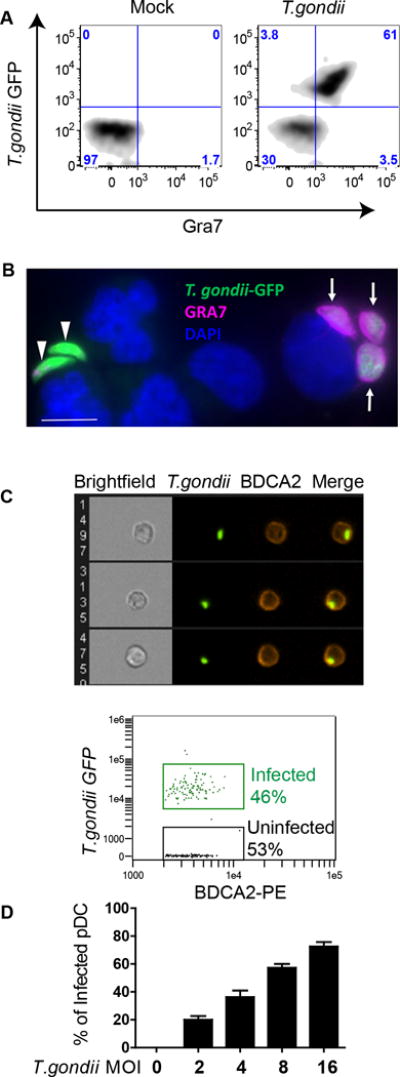
Figure 1. T. gondii infects human pDC and establishes a parasitophorous vacuole membrane (PVM).

A, Establishment of PVM was quantified using intracellular flow cytometric staining against GRA7 in BDCA2 and CD123 positive pDC infected with T. gondii RH- GFP at MOI 4. A representative flow figure showing Gra7+/T. gondii-GFP+ cells is shown. B, Fluorescent microscopy images of purified pDC infected with T. gondii-GFP and stained with anti-GRA7 (pink) to visualize parasitophorous vacuole membrane (PVM) and with DAPI (blue) to visualize nuclei. Arrows indicate GRA7+/GFP+ parasitophorous vesicles in an infected cell, while green T. gondii indicate extracellular parasites. Scale bar representing 5μ is shown on figure, lower left, in white. C, Purified pDC were infected with T. gondii RH- GFP at MOI 8 for 1hr and stained with anti-BDCA2-PE. Infection of pDC was visualized and quantified using AMNIS ImageStream. Upper panel: representative images of single pDC (BDCA2+ cells) that have internalized T. gondii. Lower panel: Percent pDC that internalized T. gondii from a representative ImageStream experiment. Data shown are from a single experiment representative of three independent experiments. D, Flow cytometry was used to determine optimal MOI of T. gondii 1 hr post infection from three independent experiments (Mean ± SEM).
