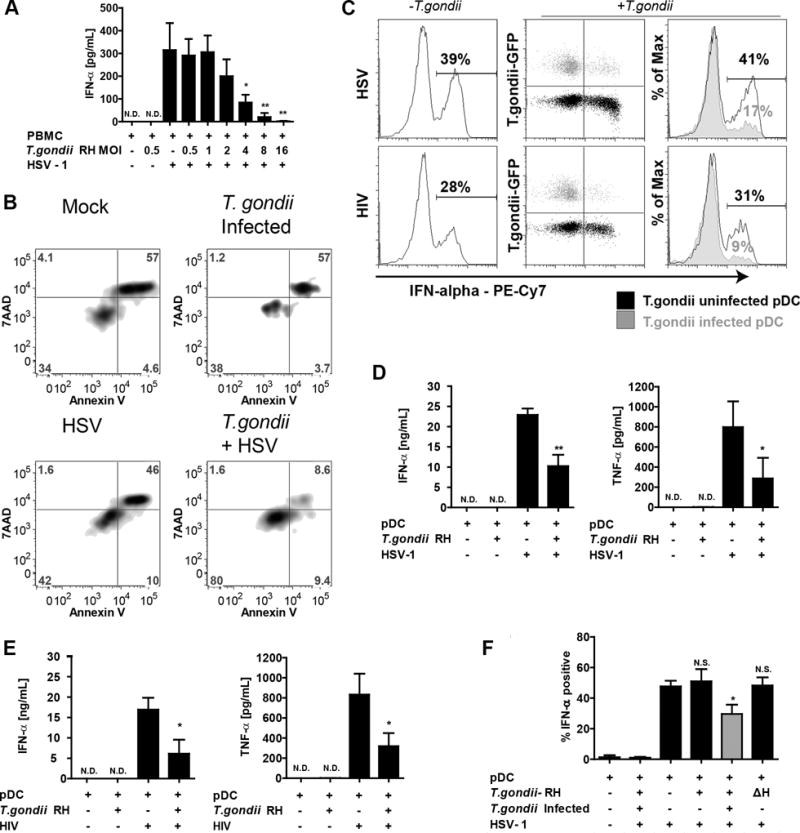
Figure 2. T. gondii inhibits HSV-1 and HIVMN triggered production of IFN-a and TNF-a in parasite infected pDC.

A, PBMC were pre-infected with increasing MOI of T. gondii RH for 1 hr followed by 18 hrs stimulation with HSV-1. IFN-a levels in supernatants were quantified using sandwich ELISA. Data are from mean ± SEM for three independent experiments. Inhibition of HSV-1 induced IFN-α by T. gondii was determined using 1-way ANOVA with Dunnett’s Multiple Comparison Test. B, The effect of T. gondii on pDC was determined by Annexin V/7AAD 18 hours after infection with T. gondii. C, Purified pDC were pre-infected with T. gondii-GFP at MOI 4 and exposed to HSV-1 at MOI 1 or 500ng/mL p24 equivalents of AT-2 inactivated HIVMN. Cells were collected at 6 hrs and analyzed by intracellular flow cytometry for expression of IFN-a. On the right, overlay of T. gondii infected population (gray) and T. gondii uninfected population (black) from the same sample, numbers represent % of IFN-a positive cells in T. gondii uninfected or infected populations. Data are representative of three independent experiments. D,E, Purified pDC were pre-infected with T. gondii-GFP followed by HSV-1 (D) or AT-2 inactivated HIVMN (E) treatments for 18 hrs. Supernatants were collected and analyzed for production of IFN-a and TNF-α production using ELISA. Data are mean ± SEM for N=3 experiments. F, Inhibition of IFN-a by T. gondii RH in pDC from PBMC population. BDCA2 and CD123 positive pDC were gated and analyzed for intracellular expression of IFN-a in T. gondii uninfected (GFP-, black) or infected (GFP+, gray) cells as described in panel B. Heat inactivated parasite (ΔH) was used to determine whether parasite needs to be alive to inhibit IFN-a. Data are mean ± SEM of three independent experiments. Data analyzed using one-way ANOVA with Tukey’s post-test using GraphPad Prism. *p<0.05, **p<0.01, **p<0.001, ns-not significant vs. virus treatment.
