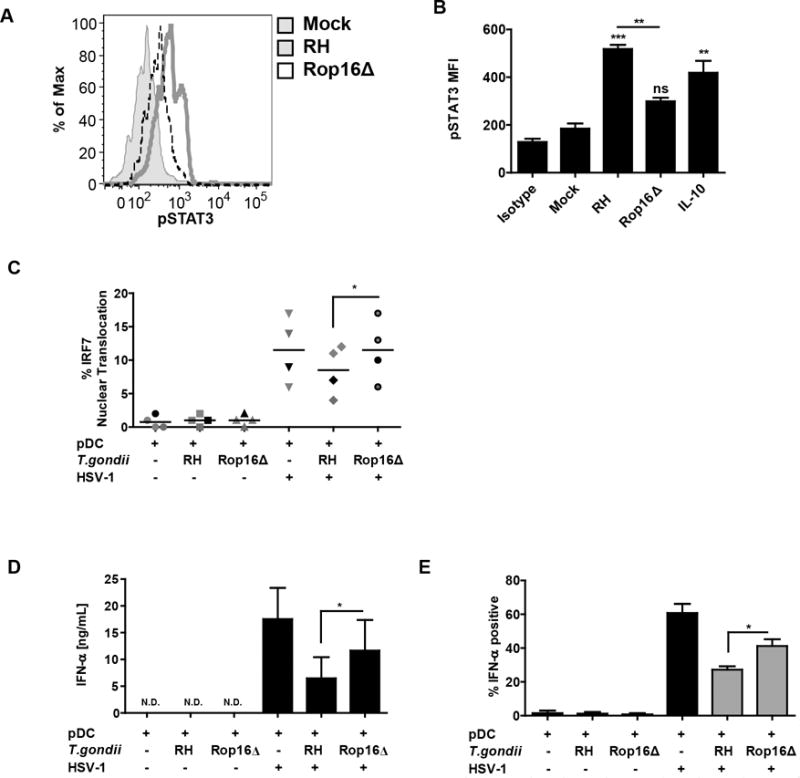
Figure 6. ROP16 kinase is involved in inhibition of IFN-α production and nuclear translocation of IRF7.

A, Histogram overlay compares pSTAT3 signal between the parental RH strain and the rop16 knockout parasite (RHΔrop16). Loss of ROP16 mediated phosphorylation of STAT3 was measured as described in Figure 5B. B, Quantification of result from panel A from four independent experiments with 15 min IL-10 stimulation used as a control for STAT3 phosphoryation. *’s and “ns” are for statistical analysis of each treatment vs Mock, while the bar represents comparison of wild type vs. Rop16 knockout parasite, as carried out by Anova with Tukey’s post-hoc test. C, Ability of T. gondii to inhibit IRF7 nuclear translocation was lost in RHΔrop16, experiments conducted as described in Figure 4B 5 hrs after stimulation with HSV. D, T. gondii mediated inhibition of IFN-α was compared between the parental RH strain and the rop16 knockout parasite (RHΔrop16). Purified pDC were pre-infected with indicated strain of T. gondii followed by 18 hrs stimulation of HSV, secreted IFN-α was measured using ELISA. E, Flow cytometric analysis of IFN-α production in pDC infected with RH or RHΔrop16. BDCA2+/CD123+ pDC were stained for intracellular expression of IFN-α and SAG1. Gray bars indicate T. gondii infected cells (SAG1 positive). For C, D and E, data are from four independent experiments and were analyzed by Anova with Tukey’s post hoc test comparing each of the groups exposed to HSV.
