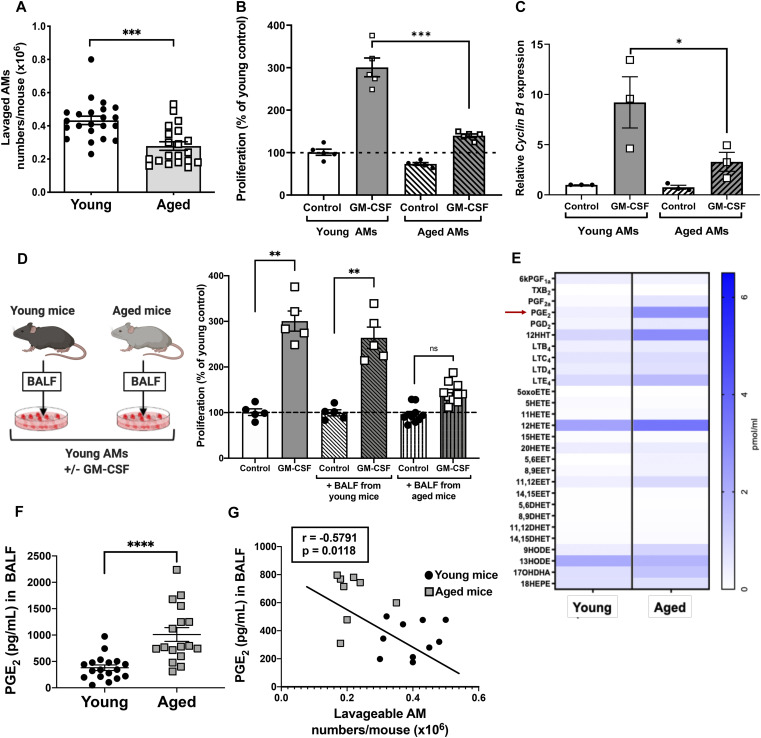
Figure 1. Alveolar macrophage (AM) proliferation is decreased in aged mice in association with elevated levels of PGE2.
(A) Absolute numbers of AMs enumerated from BALF of young (6–8 wk old) and aged (18–22 wk old) mice (n = 20–22 mice). (B) Primary AMs isolated from young and aged mice were treated with mouse GM-CSF (10 ng/ml) and incubated for 5 d and subjected to CyQuant proliferation assay measuring total cellular DNA (n = 5 mice). (C) Expression of Cyclin B1 mRNA measured by RT-PCR in young and aged primary AMs treated with GM-CSF for 48 h (n = 3 separate experiments). (D-left panel) Schematic depicting young and aged BALF swap experiment. (D-right panel) Proliferation of young AMs incubated for 5 d in the presence of young or aged BALF, or medium alone, with or without GM-CSF (n = 5–9 mice). (E) Heat map of lipids that were elevated in BALF from both young (n = 4 mice) and aged (n = 3 mice) mice. (F) Levels of PGE2 from young or aged BALF quantified by ELISA (n = 17–18 mice). (G) Pearson’s correlation analysis between AM numbers and PGE2 levels in matched BALF samples from individual mice (n = 18 mice; 10 young, 8 aged). (A, B, C, D, E) Results in (B, C, D) are values expressed relative to those in unstimulated young AMs, and all data represent the mean ± SEM of the values indicated by individual symbols; ns, non-significant, *P < 0.05, **P < 0.01, ***P < 0.001; t test (A, E) or one-way ANOVA followed by Sidak’s test for multiple comparisons (B, C, D).

