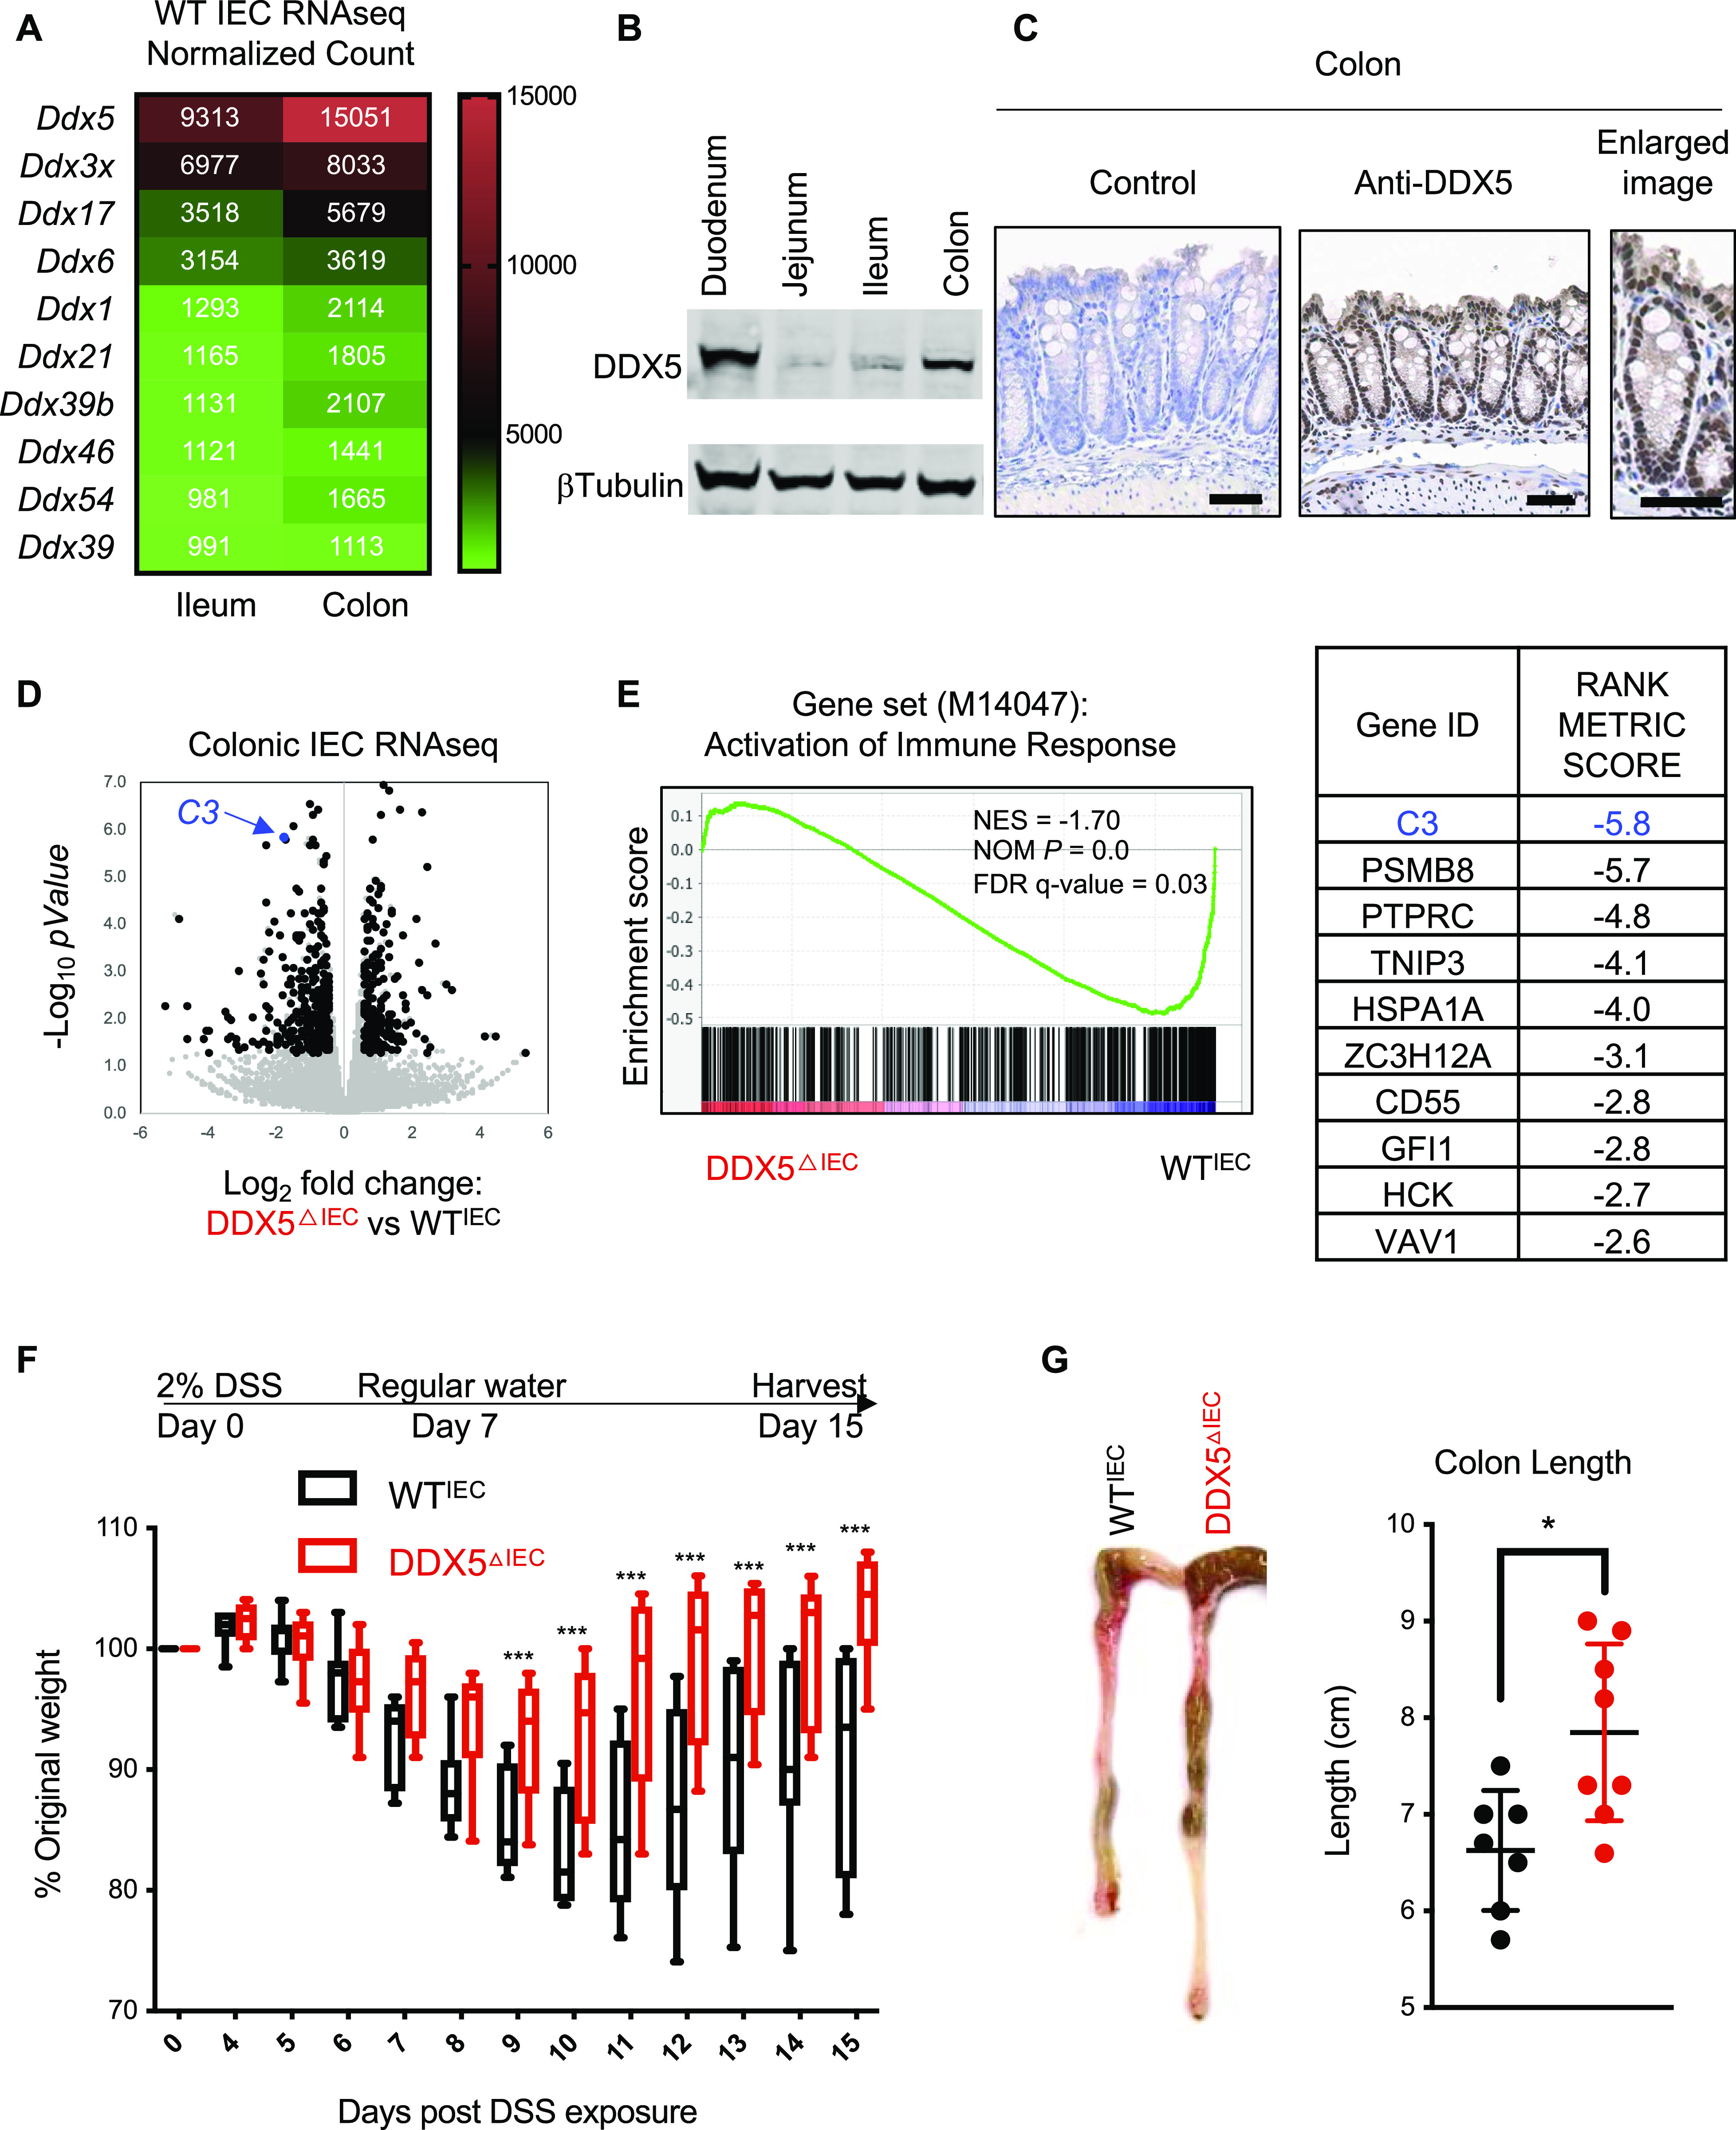
Figure 1. DDX5 regulates colonic epithelial immune response program and contributes to colitis.
(A) Heat map of average normalized RNAseq read counts of the 10 highest expressed members of the DDX family in the ileum and colon of steady-state WT mice (n = 2). (B) Representative Western blots showing DDX5 and β-tubulin protein expression in intestinal epithelial cells (IECs) from different sections of the intestine in WT mice. Experiments were repeated three times using independent biological samples with similar results. (C) Representative images from immunohistochemistry analysis of DDX5 in the colon of WT mice. Enlarged image is shown on the right. Scale bar represents 50 μm. (D) Scatterplot of log2 (fold changes: DDX5ΔIEC over WTIEC) and −log10(P-values) of colonic IEC transcripts. RNAseq was performed on two independent pairs of cohoused DDX5ΔIEC over WTIEC littermates. Black dot: DDX5-dependent transcripts defined as log2 (fold changes: DDX5ΔIEC over WTIEC) ≥0.5 or ≤−0.5 and P-value < 0.05 (DESeq). C3 is indicated in blue. (E) Left: Gene set enrichment analysis of immune response activation (M14047) in DDX5-deficient and DDX5-expressing colonic IECs from steady-state mice. NES, normalized enrichment score; NOM P, normalized P-value. Right: Ranked top 10 DDX5-regulated genes involved in immune response activation. (F) Weight loss of WTIEC (n = 7) and DDX5ΔIEC (n = 9) mice challenged with 2% DSS in their drinking water. This experiment was repeated twice with similar results. Error bars represent SD. ***P < 0.001 (multiple t test). (G) Colonic length in mice from (F) on day 15 post-DSS challenge. Each dot represents one mouse. Results are means ± SD. *P < 0.05 (t test).
Source data are available for this figure.

