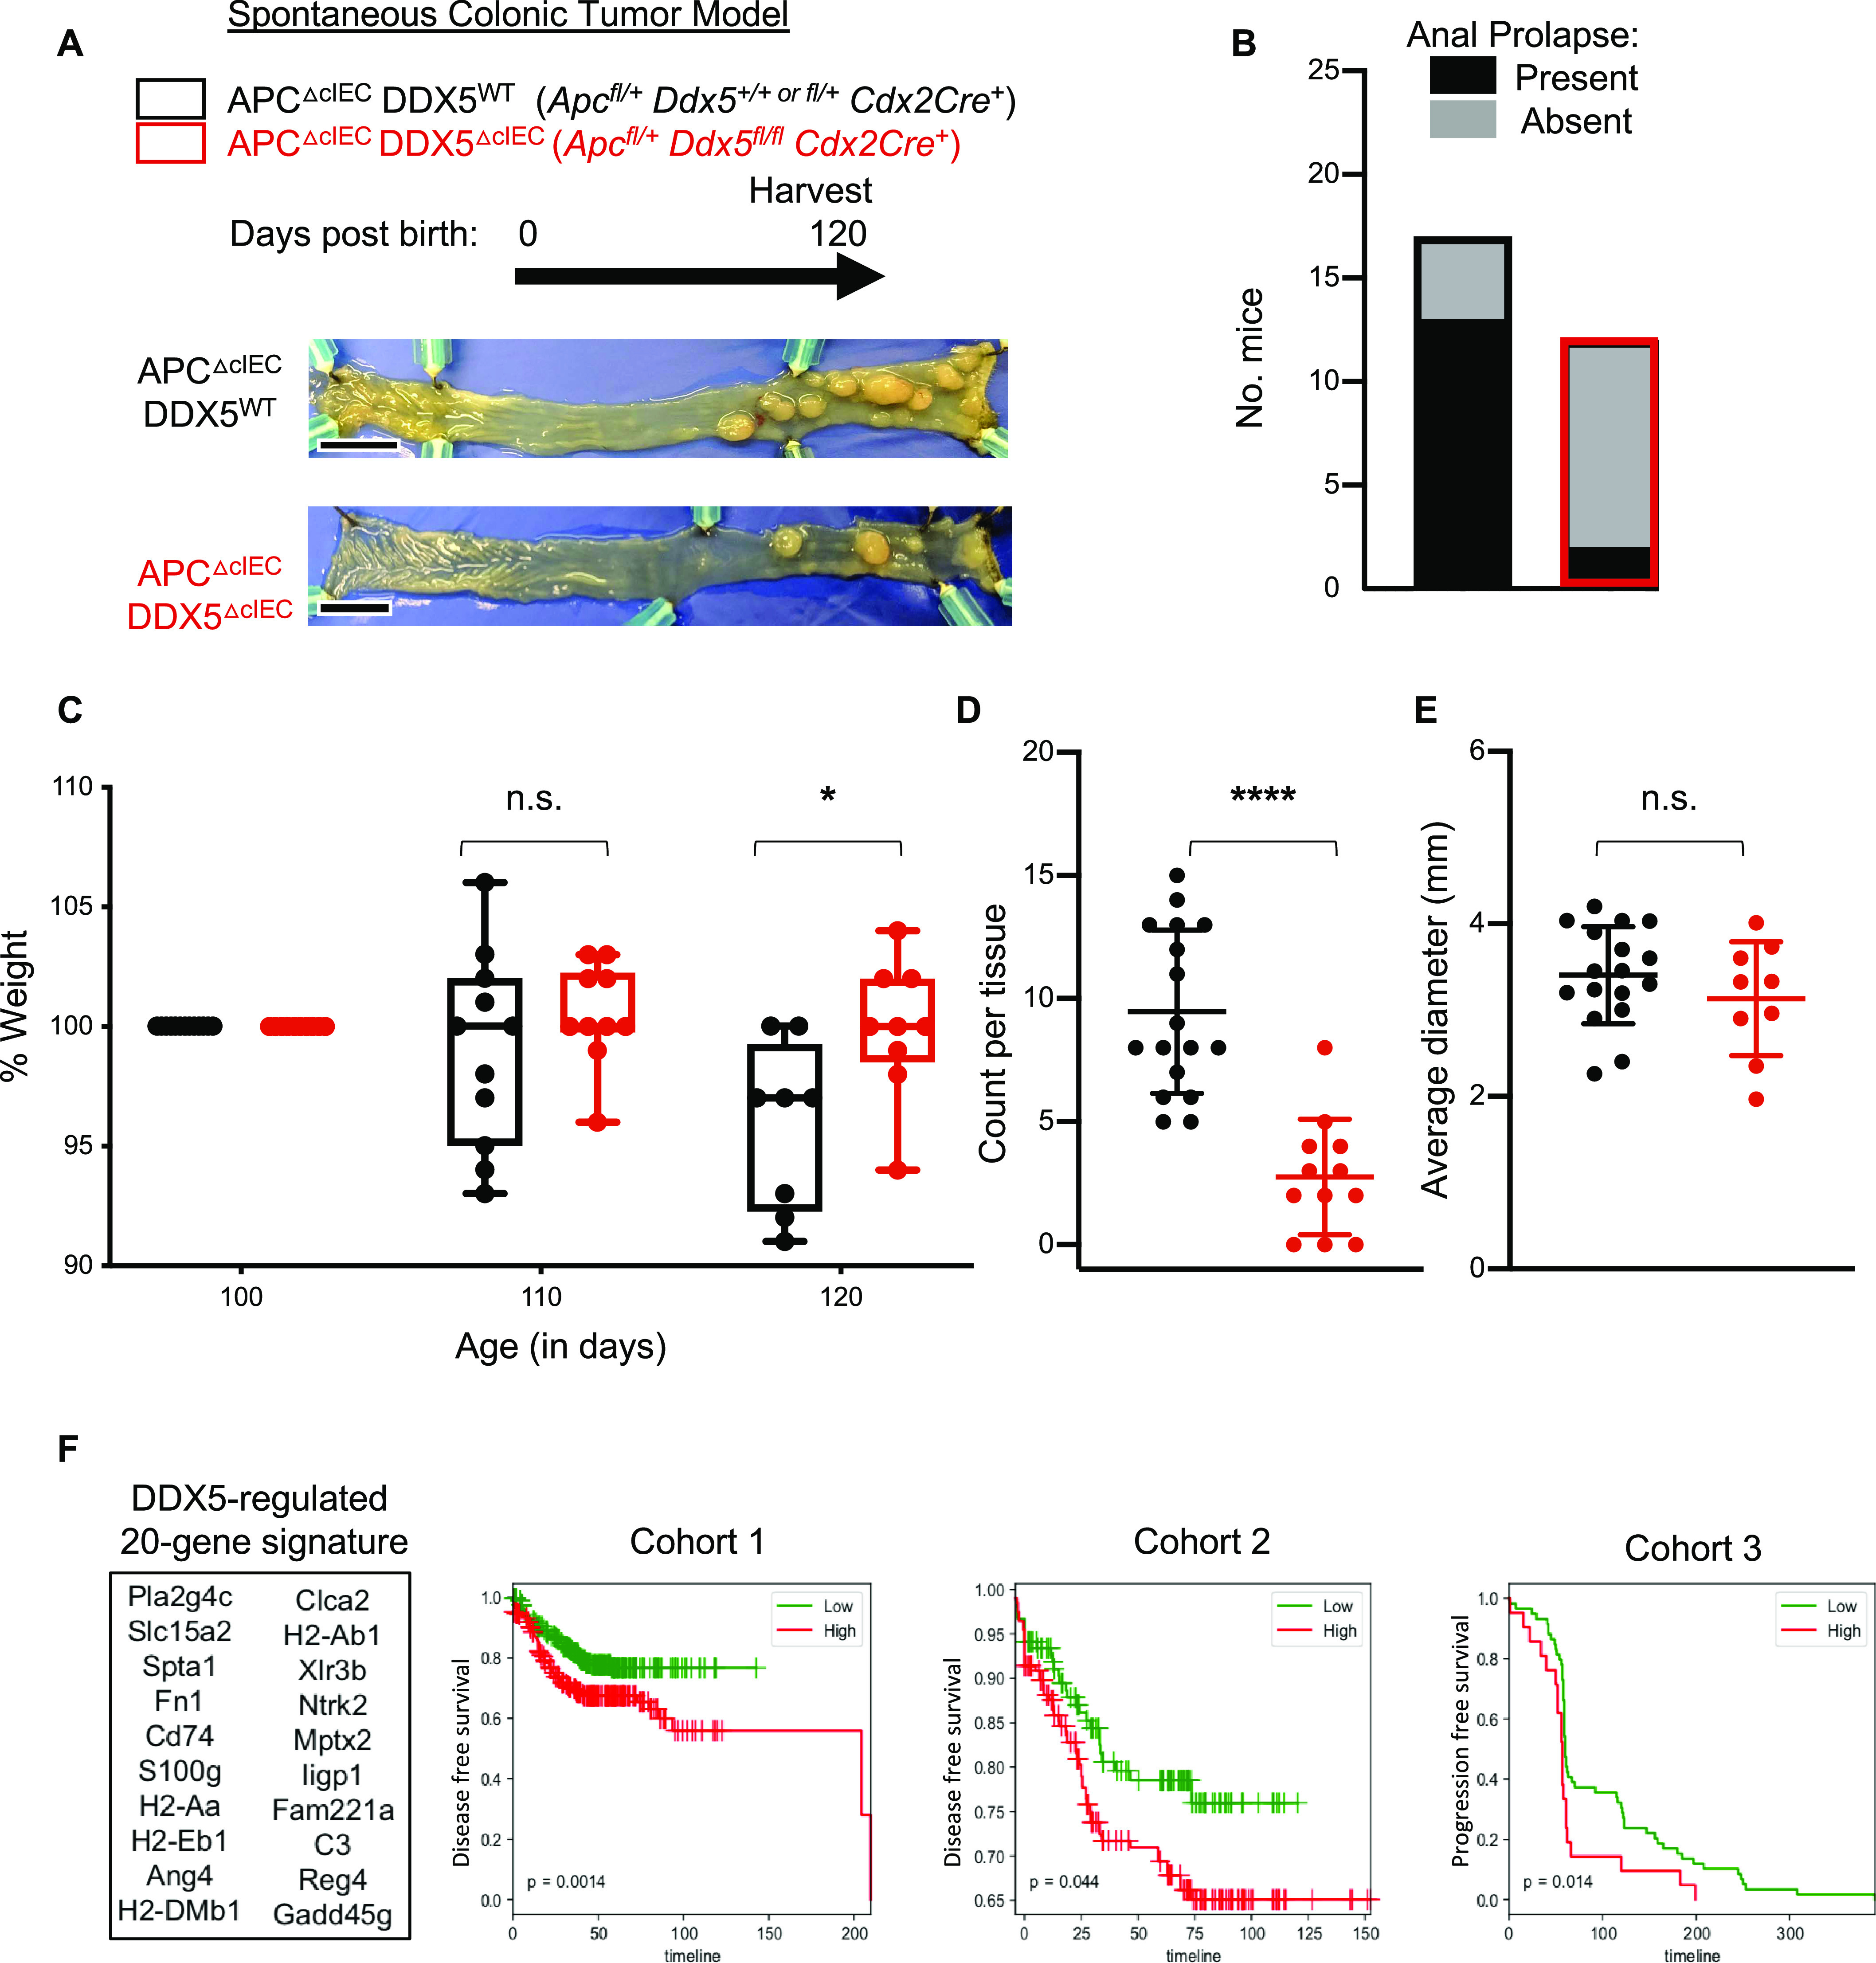
Figure 2. DDX5 promotes colonic tumorigenesis in Apc-mutant mice.
(A) Representative bright-field images of tumor-bearing colons from APCΔcIECDDX5WT and APCΔcIECDDX5ΔIEC animals. Scale bar equals 1 cm. (B) Anal prolapse incidents recorded in mice described in (A). (C) Percent weight change of each mice in (A) on day 110 and 120 compared to day 100. Each dot represents one mouse. Weight change from DDX5-sufficient samples are shown in black (n = 15). Weight change from DDX5 knockouts are shown in red (n = 9). Data shown are means ± SD. *P < 0.05 (t test). (D) Colonic tumor counts from APCΔcIECDDX5WT (n = 17) and APCΔcIECDDX5ΔcIEC (n = 12) tumor-bearing animals. Each dot represents one mouse. Data shown are means ± SD. **** P-value < 0.0001 (t test). (E) Average colonic tumor diameter (mm) from APCΔcIECDDX5WT (n = 17) and APCΔcIEC DDX5ΔcIEC (n = 9) tumor-bearing animals. Each dot represents one mouse. Data shown are means ± SD. n.s., not significant (t test). (F) Expression of the DDX5-dependent colonic gene signature predicts clinical outcome in colorectal cancer patients. Top 20 genes were selected based on criteria listed in the Materials and Methods section. Kaplan–Meier analysis of disease-free survival in cohort 1 (GSE13067, GSE14333, GSE17538, GSE31595, GSE37892, and GSE33113), cohort 2 (GSE87211), and progression-free survival in cohort 3 (GSE5851).
Source data are available for this figure.

