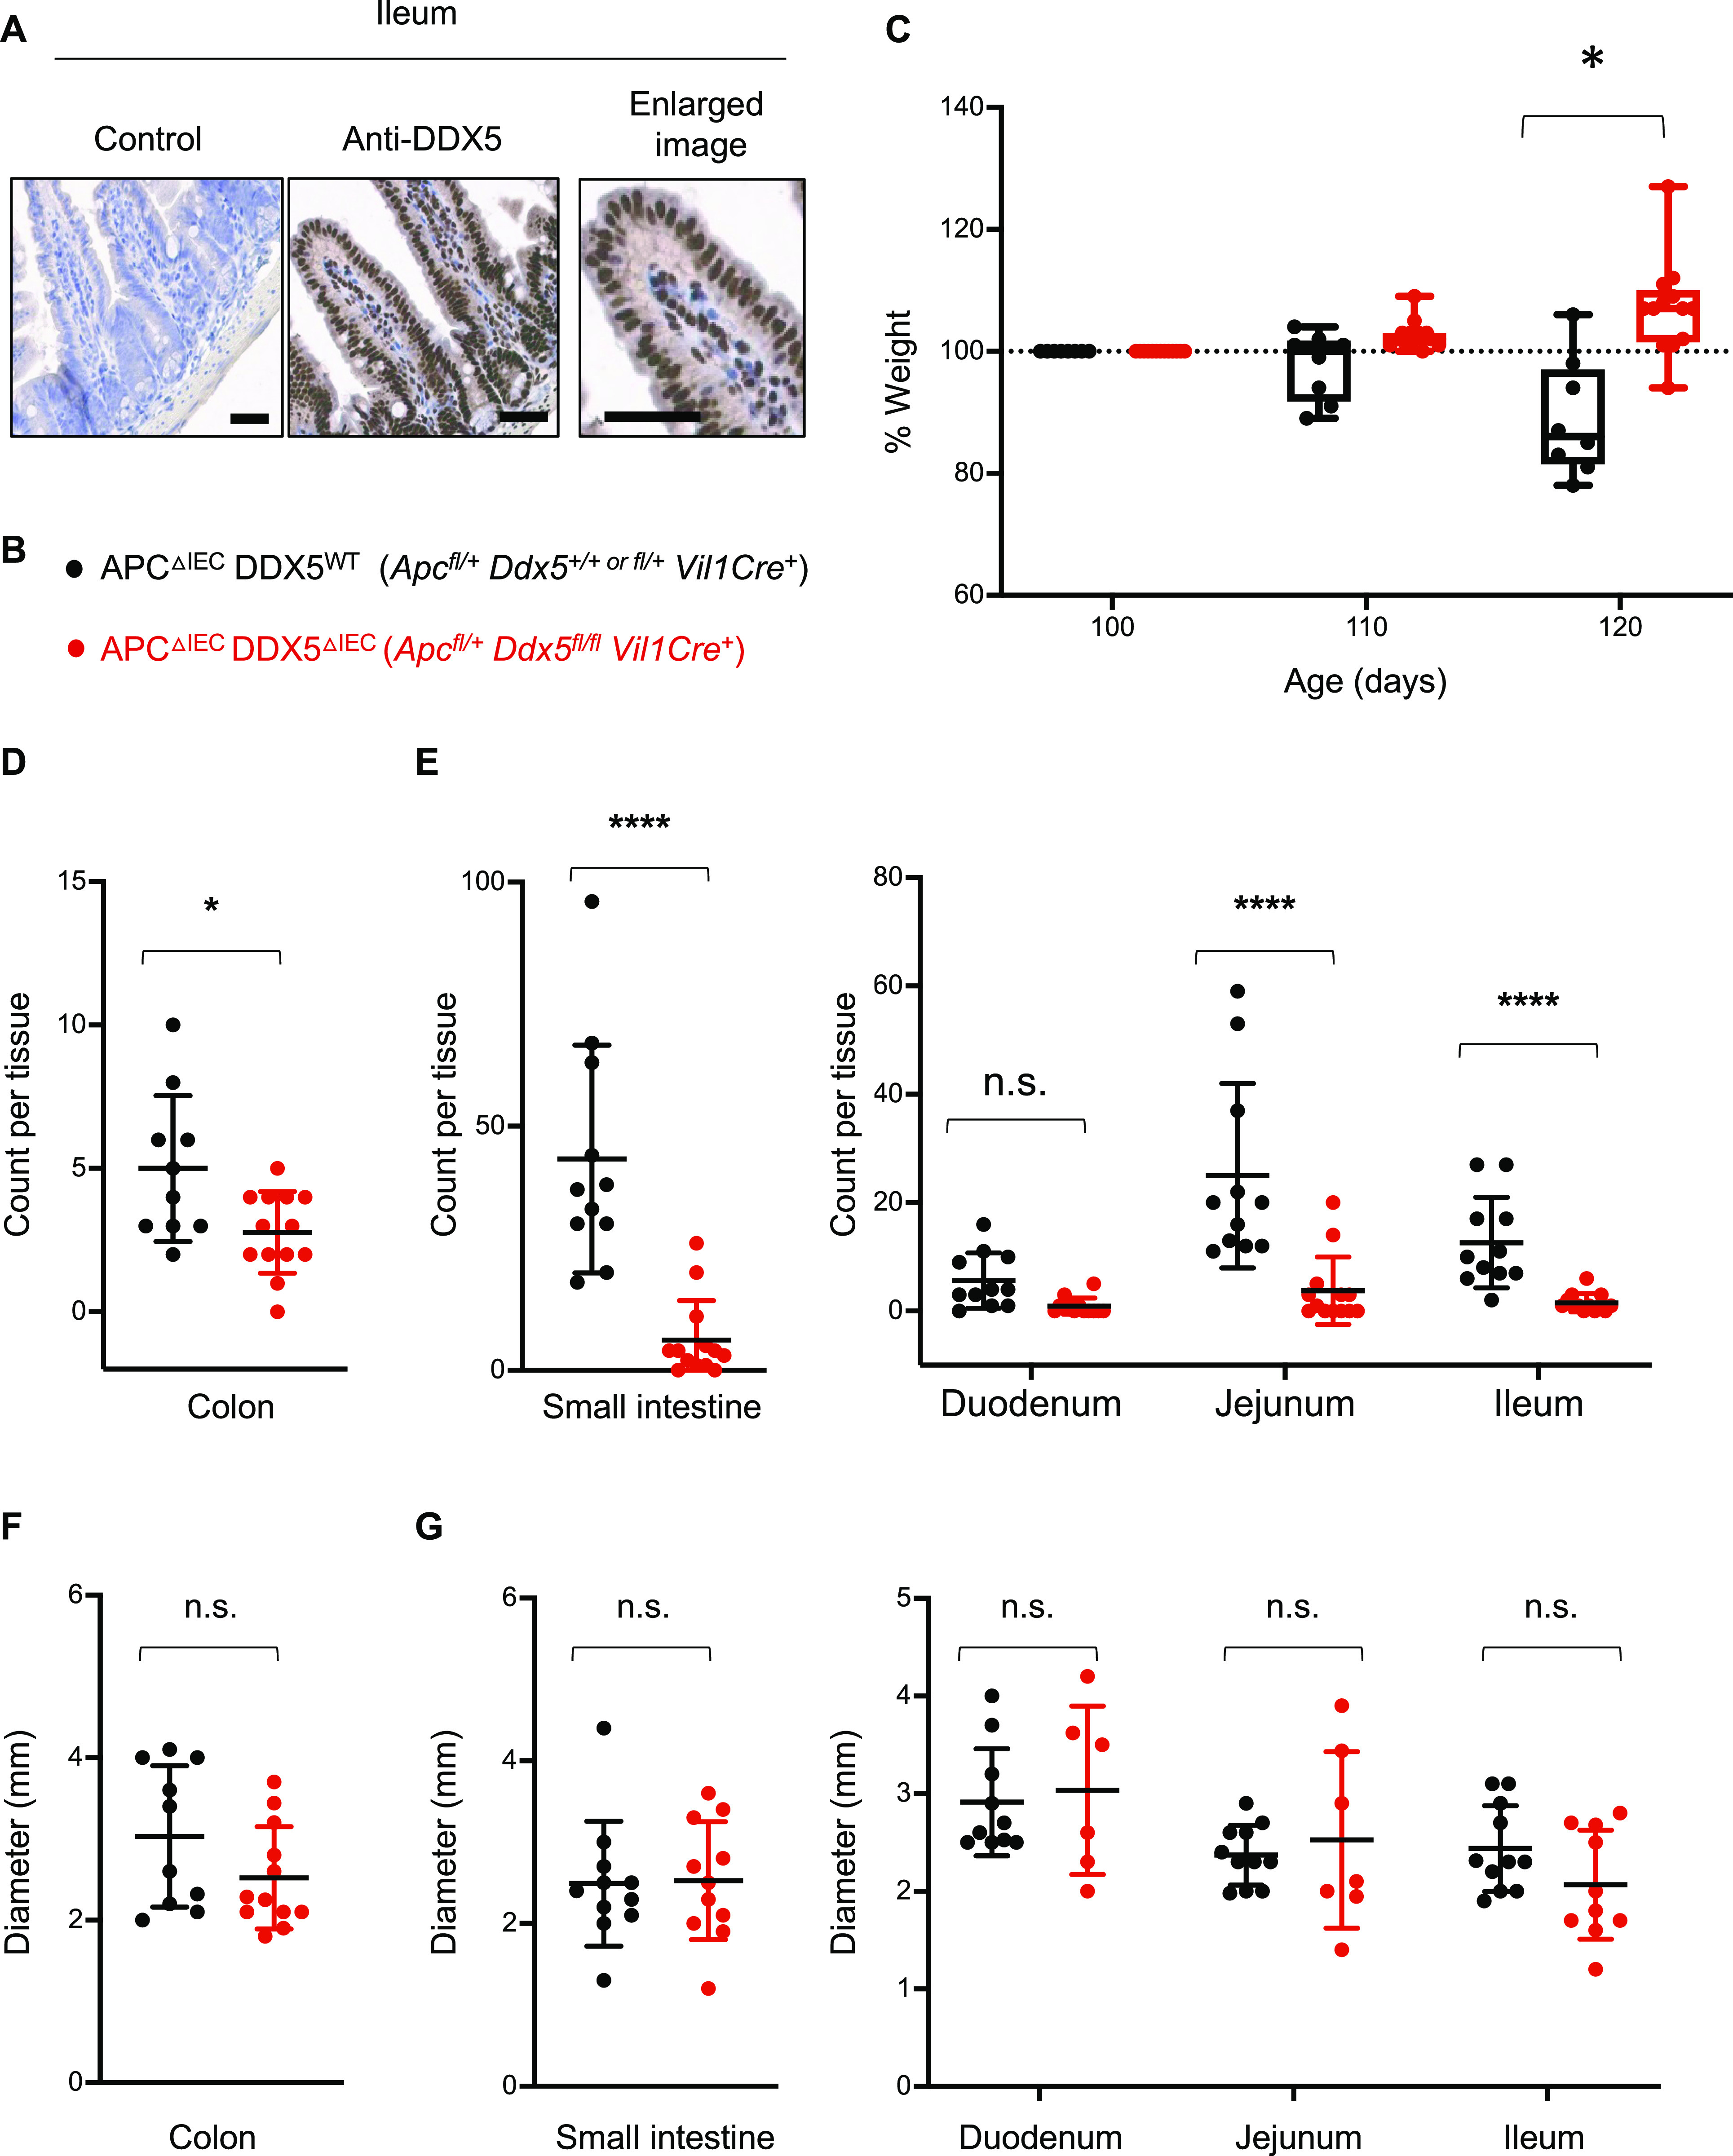
Figure 4. DDX5 also promotes tumorigenesis in the small intestine.
(A) Representative images from immunohistochemistry analysis of DDX5 in the ileum of WT mice. Enlarged image is shown on the right. Scale bar represents 50 μm. (B, C, D, E, F, G) Genotypes of tumor-bearing APCΔIECDDX5WT and APCΔIECDDX5ΔcIEC littermates used in (C, D, E, F, G). (C) Percent weight change of each mouse in (B) on days 100, 110, and 120. Each dot represents one mouse. Data shown are means ± SD. Each dot represents one mouse. Weight change from DDX5-sufficient samples are shown in black (n = 10). Weight change from DDX5 knockouts are shown in red (n = 13). Data shown are means ± SD. *P < 0.05 (multiple t test). (D) Macroscopic tumor counts in the colon. Each dot represents one mouse. Counts from DDX5-sufficient samples are shown in black (n = 12) and counts from DDX5 knockouts are shown in red (n = 13). Data shown are means ± SD. *P < 0.05 (t test). (E) Left: total macroscopic tumor counts in the small intestine. Right: Macroscopic tumor counts in different segments of the small intestine. Each dot represents one mouse. Counts from DDX5-sufficient samples are shown in black (n = 12) and counts from DDX5 knockouts are shown in red (n = 13). Data shown are means ± SD. n.s., not significant. ****P < 0.0001 (multiple t test). (F) Average tumor diameters in the colon. Each dot represents one mouse. Diameters from DDX5-sufficient samples are shown in black (n = 12) and diameters from DDX5 knockouts are shown in red (n = 13). Data shown are means ± SD. n.s., not significant (t test). (G) Left: Average tumor diameters in the small intestine. Right: average tumor diameters in different segments of the small intestine. Each dot represents one mouse. Diameters from DDX5-sufficient samples are shown in black (n = 12) and diameters from DDX5 knockouts are shown in red (n = 13). Data shown are means ± SD. n.s., not significant (t test).
Source data are available for this figure.

