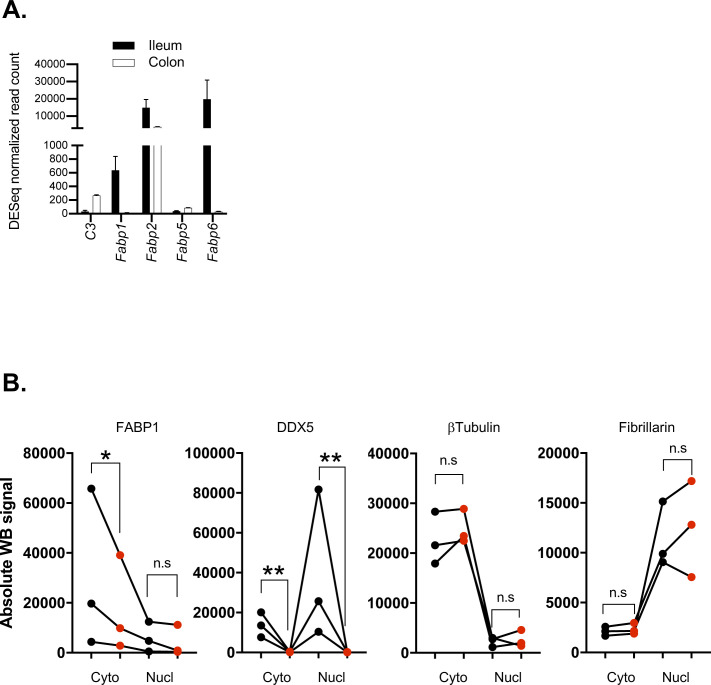
Figure S10. Quantification of protein expression in WTIEC and DDX5ΔIEC small intestine intestinal epithelial cells (IECs).
(A) Normalized RNAseq read counts of transcripts encoding C3 and members of the FABP family in the ileum and colon of steady-state WT mice. RNAseq was performed on ileal and colonic IECs from two independent WT mice. Data shown are normalized read count means ± SD. (B) Quantification (LiCoR: ImageStudio) of the Western blot signals from Fig 5E (Nucl, nuclear; Cyto, cytoplasmic fractions). Dots represent the quantification from each independent experiment. n = 3. *P < 0.05, **P < 0.01, n.s., not significant (paired t test).

