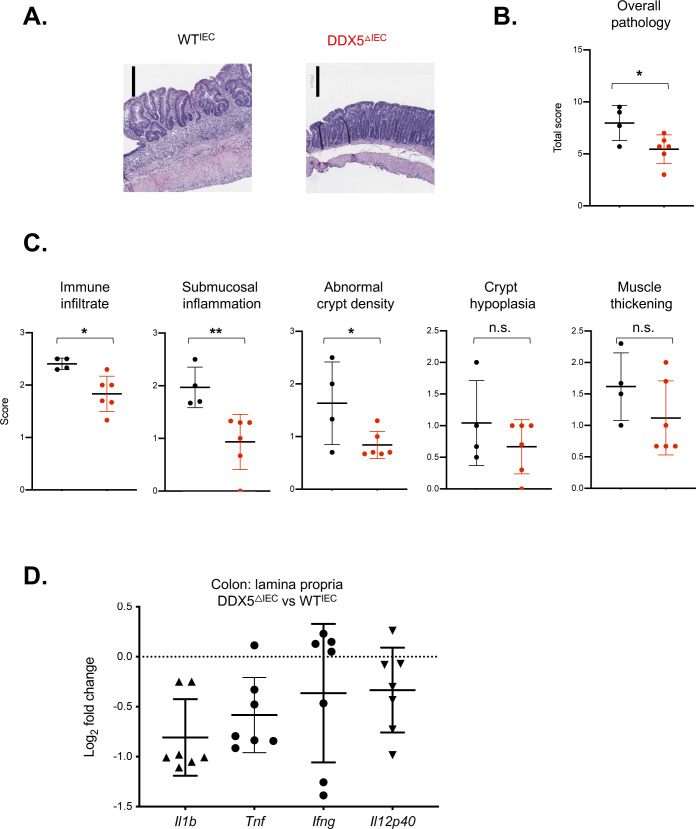
Figure S3. DSS histology and inflammatory gene expression.
(A) Representative images of H&E-stained sections of colons from WT and DDX5ΔIEC mice on day 15 post-DSS treatment. Scale bar represents 250 μm. (B) Overall histology scores of distal colons from WT (n = 4) and DDX5ΔIEC (n = 6) mice 15 d post-DSS treatment. (C) Distal colons from WT (n = 4) and DDX5ΔIEC (n = 6) mice challenged with 2% DSS scored by immune infiltrate, submucosal inflammation, crypt density, crypt hyperplasia, and muscle thickening. (D) RNAs from the colonic lamina propria mononuclear cells from mice treated with 2% DSS in their drinking water for 7 d were evaluated for the expression of inflammatory genes. Each dot represents one mouse.

