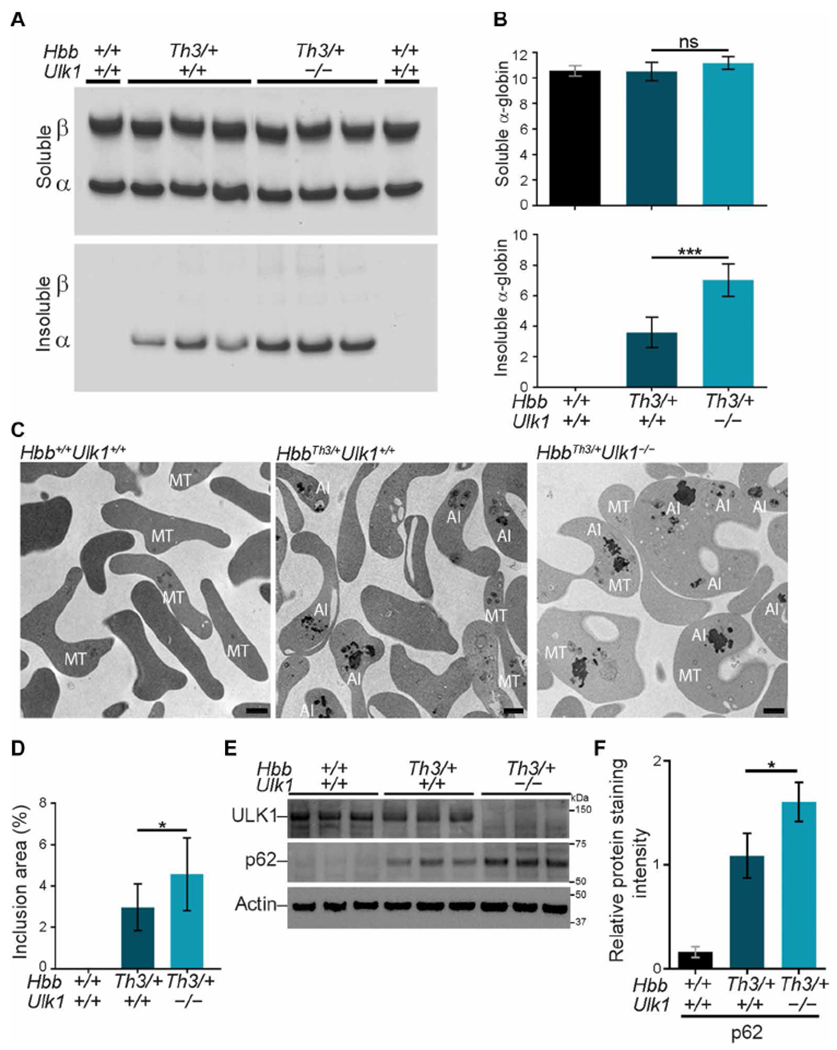
Fig. 2. ULK1 loss in β-thalassemia increases accumulation of insoluble α-globin.

WT mice were transplanted with fetal liver HSCs as in Fig. 1B and analyzed 90 to 120 days later. (A) Soluble and insoluble globins in RBCs. Equal volumes of RBCs (normalized by hematocrit) were lysed, centrifuged to separate insoluble and soluble proteins, fractionated by TAU gel electrophoresis to resolve α- and β-globin proteins, and stained with Coomassie brilliant blue. (B) Results of multiple experiments performed as in (A). The y axes represent the relative soluble and insoluble α-globin staining intensities on TAU gels measured by automated image analysis and expressed in arbitrary units. Hbb+/+Ulk1+/+, n = 4; HbbTh3/+Ulk1+/+, n = 11; HbbTh3/+Ulk1−/−, n = 8. (C) Thiazole orange–stained reticulocytes were isolated by fluorescence-activated cell sorting (FACS) to a purity of about 95% and then analyzed by TEM. AI, α-globin inclusions; MT, mitochondria. Scale bars, 1 μm. (D) Areas of electron-dense α-globin inclusions in reticulocytes (y axis) determined by automated image analysis of electron micrographs. Hbb+/+Ulk1+/+, n = 7; HbbTh3/+Ulk1+/+, n = 11; HbbTh3/+Ulk1−/−, n = 12. About 100 to 200 cells from each mouse were analyzed. (E) Western blot analysis of autophagy proteins ULK1 and p62 in FACS-purified reticulocytes from mice with the indicated genotypes. Migration of protein molecular weight standards is shown on the right. (F) Results of multiple experiments performed as in (E). The y axis represents the relative protein staining intensity on Western blots, measured by automated image analysis, normalized to β-actin, and shown in arbitrary units: n = 3 mice for each genotype. Data are mean values ± SDs; ***P < 0.001; *P < 0.05; ns, not significant.
