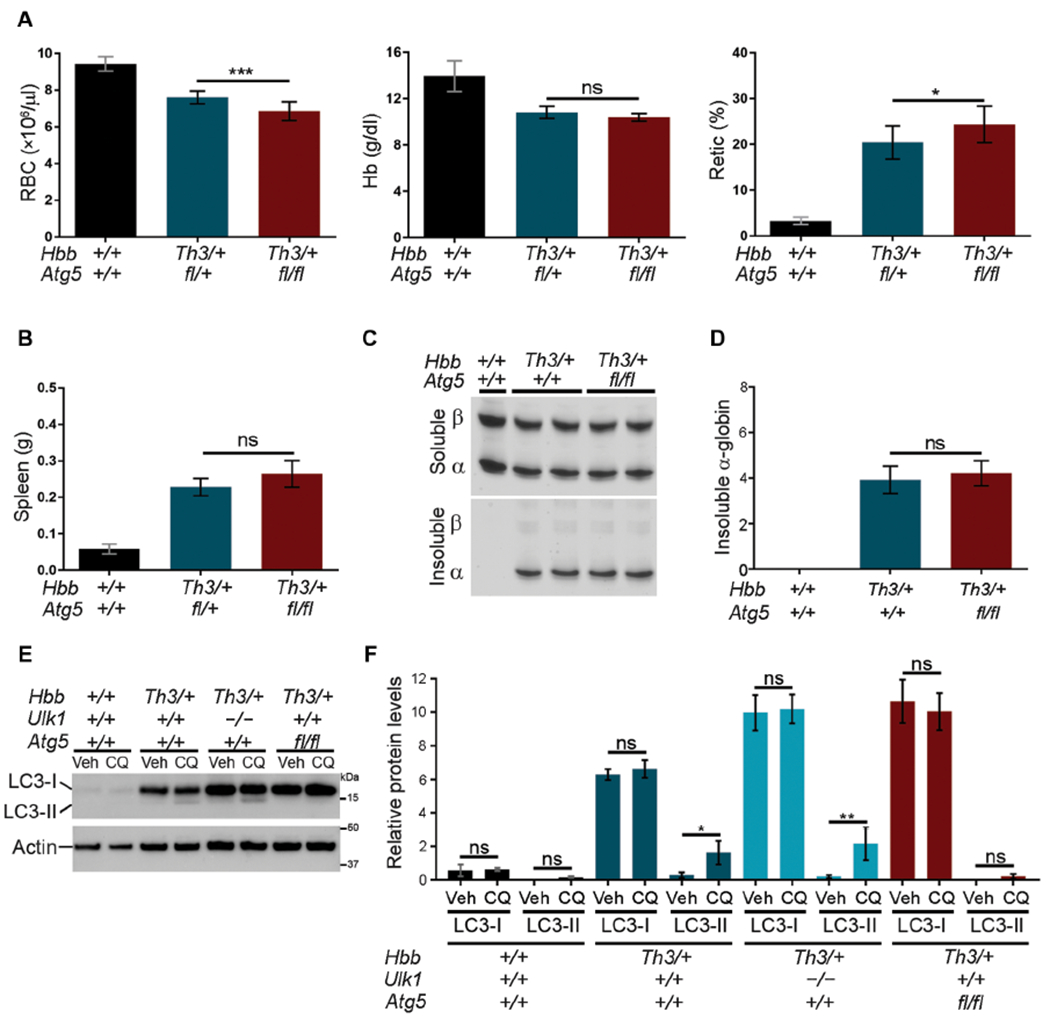
Fig. 3. Clearance of free α-globin in β-thalassemia is largely ATG5 independent.

(A) Erythroid indices (y axis) of mice with the indicated germline genotypes (x axis) at 5 months of age: Hbb+/+Atg5+/+, n = 10; HbbTh3/+Atg5+/+, n = 10; HbbTh3/+Atg5fl/fl, n = 12. The Atg5 fl allele refers to an erythroid-specific targeted disruption of Atg5 (fig. S5). (B) Spleen weight according to genotype. Hbb+/+Atg5+/+, n = 10; HbbTh3/+Atg5+/+, n = 5; HbbTh3/+Atg5fl/fl, n = 4. (C) Soluble and insoluble α-globin in RBCs determined as described for Fig. 2A. (D) Results of multiple experiments performed as in (C) and quantified as described for Fig. 2B. Hbb+/+Atg5+/+, n = 5; HbbTh3/+Atg5+/+, n = 8; HbbTh3/+Atg5fl/fl, n = 8. (E) Western blot analysis of LC3 in FACS-purified reticulocytes cultured for 3 hours with chloroquine (CQ) to inhibit lysosomal proteases or with vehicle (Veh). Migration of protein molecular weight standards is shown on the right. (F) Results of multiple experiments performed as in (E), measured by automated image analysis, normalized to β-actin, and shown in arbitrary units: n = 4 mice for each genotype. Data are mean values ± SDs; ***P < 0.001; **P < 0.01; *P < 0.05; ns, not significant.
