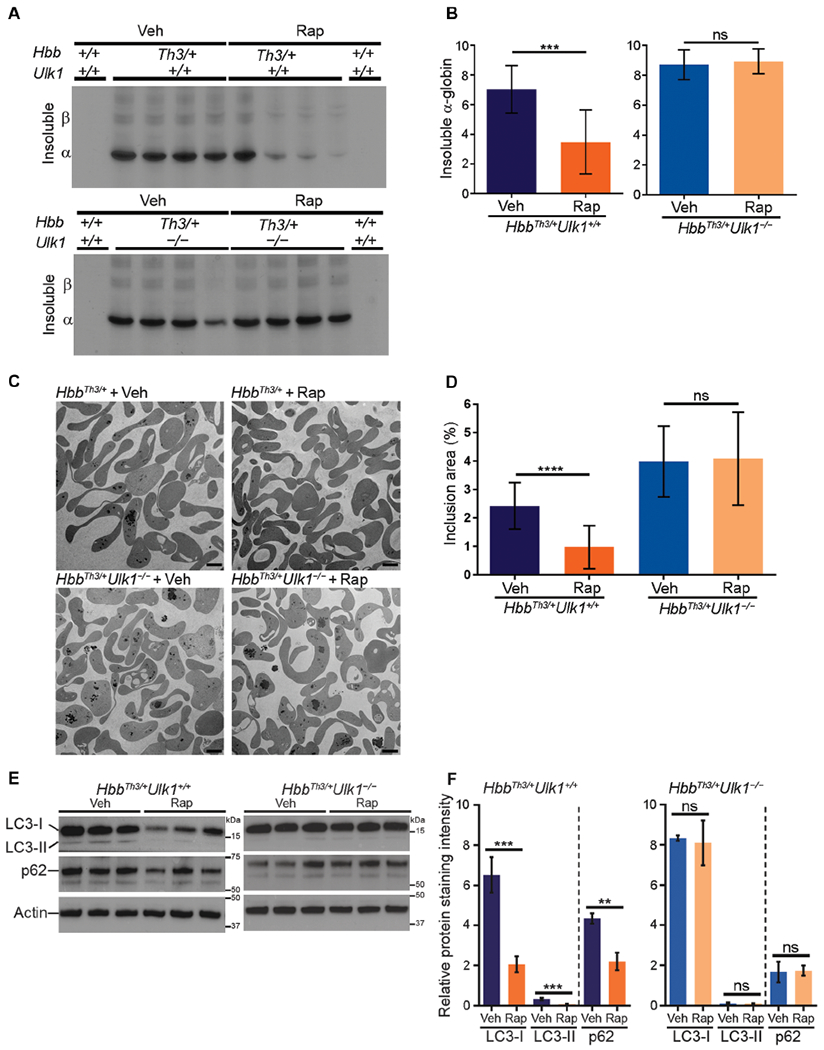
Fig. 6. Rapamycin induces ULK1-dependent elimination of free α-globin.

(A) Relative concentrations of insoluble α-globin in RBCs after 30-day treatment with rapamycin or vehicle in mice of the indicated genotypes. RBCs were analyzed as described in Fig. 2A. (B) Results of multiple experiments performed as in (A) and quantified as described for Fig. 2B. n = 7 mice for each condition shown. (C) Transmission electron micrographs of purified reticulocytes in mice with HSCs of the indicated genotypes treated with rapamycin or vehicle. Scale bars, 2 μm. (D) Areas of electron-dense α-globin inclusions in reticulocytes (y axis) determined by analysis of electron micrographs, as described for Fig. 2D. HbbTh3/+Ulk1+/+ + Rap, n = 7; HbbTh3/+Ulk1+/+ + Veh, n = 8; HbbTh3/+Ulk1−/− + Rap, n = 7; HbbTh3/+Ulk1−/− + Veh, n = 7. (E) Western blot analysis of LC3 and p62 in reticulocytes from mice with HSCs of the indicated genotypes treated with rapamycin or vehicle. Migration of protein molecular weight standards is shown on the right. (F) Results of multiple experiments performed as in (E). The y axis represents the relative protein staining intensity on Western blots, measured by automated image analysis, normalized to β-actin, and shown in arbitrary units: n = 4 mice for each genotype. Data are mean values ± SDs; ****P < 0.0001; ***P < 0.001; **P < 0.01; ns, not significant.
