Abstract
The impedance, cyclic voltammetry, and charge-injection properties of rectangular, sputtered iridium oxide (SIROF) electrodes have been measured in buffered physiological saline over a range of geometric surface areas (GSA) and perimeter-to-area ratios (P/A). Electrodes with a higher P/A are expected to have a lower impedance and higher charge injection capacity (Qinj), and both these effects were evident for SIROF electrodes with a GSA in the range 0.0023 - 0.0031 mm2. However, the magnitude of the effect was modest. The increase in Qinj for rectangular electrodes with a P/A ranging from 94 to 255 mm−1 was 21-26% depending on pulse width. There was a corresponding decrease in impedance (0.1 to 105 Hz) with increasing P/A and an increase in the SIROF charge storage capacity calculated from cyclic voltammetry. To assess the full usefulness of high P/A electrodes for increasing the reversible Qinj of an electrode, measurements should now be extended to chronic in vivo preparations.
I. Introduction
The impedance and charge-injection characteristics of electrodes used for neural recording and stimulation depend on the geometric surface area (GSA) and the shape of the electrode. The GSA and shape dependence arises from their influence on the transport of reactant species and counterions to and from the electrode and on the ohmic resistance of the ionic medium. These effects have been exploited previously to improve the efficiency of neural stimulation by increasing the perimeter-to-area ratio of an electrode by geometric design [1, 2, 3]. In the present paper we examine in detail how the perimeter-to-area ratio of planar, rectangular nerve electrodes affects their electrochemical properties and stimulation charge-injection capacity measured in buffered physiological saline.
II. Methods
A. Electrode Array Fabrication
Electrode arrays were fabricated on flexible polyimide substrates by spinning an 8 μm film of polyimide (HD Microsystems 2611) on to a 100 mm diameter silicon wafer and curing at 350°C. The cured polyimide was coated with a 0.5 μm thick film of amorphous silicon carbide (a-SiC) deposited by plasma enhanced chemical vapor deposition (PECVD) [4]. Thin film gold (220 nm thick) was sputtered on to the a-SiC using titanium (40 nm) as an adhesion layer and patterned by liftoff photolithography. A second layer of 0.5 μm a-SiC was deposited over the Ti/Au/Ti and the first a-SiC layer. Vias were then opened in the a-SiC by reactive ion etching (SF6) to expose the underlying gold. Photolithographically patterned photoresist was used as a mask. The vias in the a-SiC at the electrode site were close to the same shape and size desired for the electrode. A second layer of polyimide (3 μm thick) was spun-coated over the wafer and cured. Vias in the top polyimide exposing the gold at the electrode sites and contact pads were created by reactive ion etching (O2) using photoresist as a mask. A 300 nm film of sputtered iridium oxide (SIROF) was deposited onto the electrode sites using liftoff photolithography to define the shape of the SIROF [5]. A description of the SIROF electrode geometries is provided in Table 1. In the final step, individual electrode arrays were created on the wafer by RIE to define the outline of each array. A thick photolithographically patterned photoresist layer was used as a mask to define the final shape of the arrays. After the RIE process, the photoresist was stripped from the wafer and individual arrays removed from the silicon wafer.
TABLE I.
Geometry of the exposed SIROF electrodes.
| Geometric characteristics. P/A = perimeter to area ratio | |||||
|---|---|---|---|---|---|
| e# | side 1 mm | side 2 mm | area mm2 | perim. mm | P/A mm−1 |
| A-1 | diam. = 0.14 mm | 0.016 | 0.4536 | 28 | |
| A-2 | 0.144 | 0.134 | 0.019 | 0.556 | 29 |
| A-3 | 0.280 | 0.068 | 0.019 | 0.696 | 37 |
| A-4 | 1.11 | 0.022 | 0.024 | 2.264 | 94 |
| A-5 | 0.556 | 0.038 | 0.021 | 1.188 | 57 |
| A-6 | 2.21 | 0.012 | 0.027 | 4.448 | 165 |
| B-1 | diam. = 0.054 mm | 0.0023 | 0.170 | 74 | |
| B-2 | 0.094 | 0.028 | 0.0026 | 0.244 | 94 |
| B-3 | 0.13 | 0.02 | 0.0026 | 0.3 | 115 |
| B-4 | 0.182 | 0.16 | 0.0029 | 0.396 | 137 |
| B-5 | 0.258 | 0.012 | 0.0031 | 0.54 | 174 |
| B-6 | 0.362 | 0.008 | 0.0029 | 0.74 | 255 |
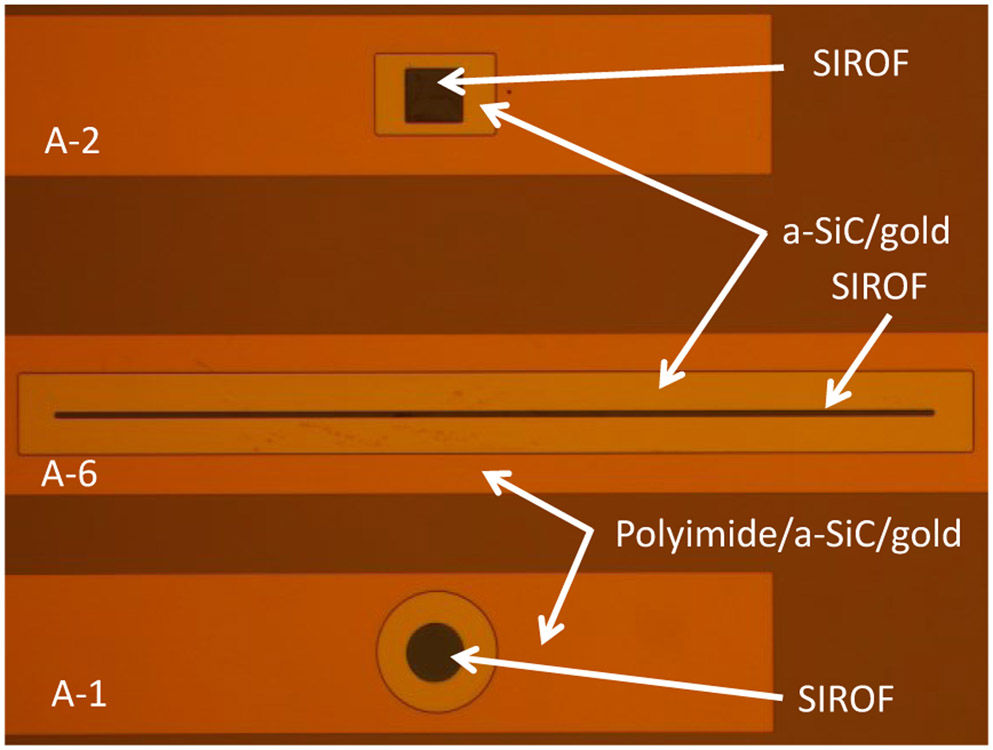
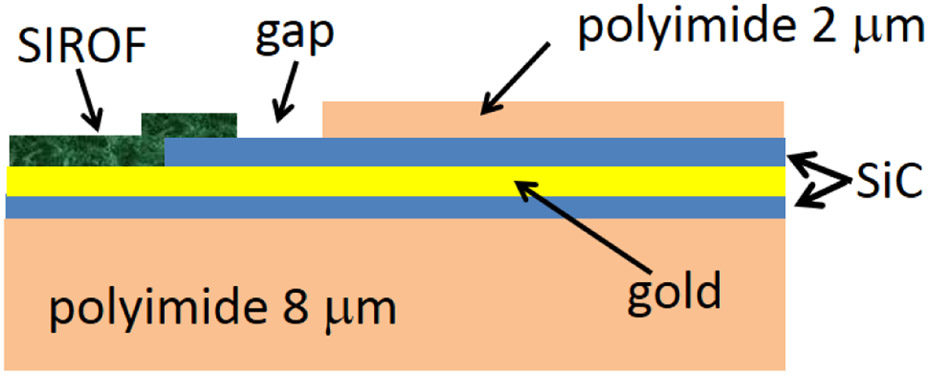
The geometry of three electrode sites is shown in the optical micrograph in Fig. 1. The image was taken in the differential interference contrast (DIC) mode which introduces false color, but is useful in identifying surface topography. Electrodes A-1, A-2 and A-6 are shown in the image (see Table 1). The vias in the top polyimide layer are made substantially larger than the size of the SIROF electrodes to avoid the electrode coating being deposited over the step at the a-SiC/polyimide junction and to avoid depositing SIROF directly onto the polyimide. The photolithography process is designed to allow the SIROF film to extend about 5 μm over the a-SiC edge at the electrode site to prevent exposure of the underlying gold to the electrolyte (Fig. 2).
Figure. 1.
Optical micrograph showing examples of three electrode geometries (see Table 1)
Figure 2.
Cross-section of an electrode site showing SIROF deposition over the edge of the SiC and a gap between the SIROF and polyimide.
B. Electrochemical Measurements
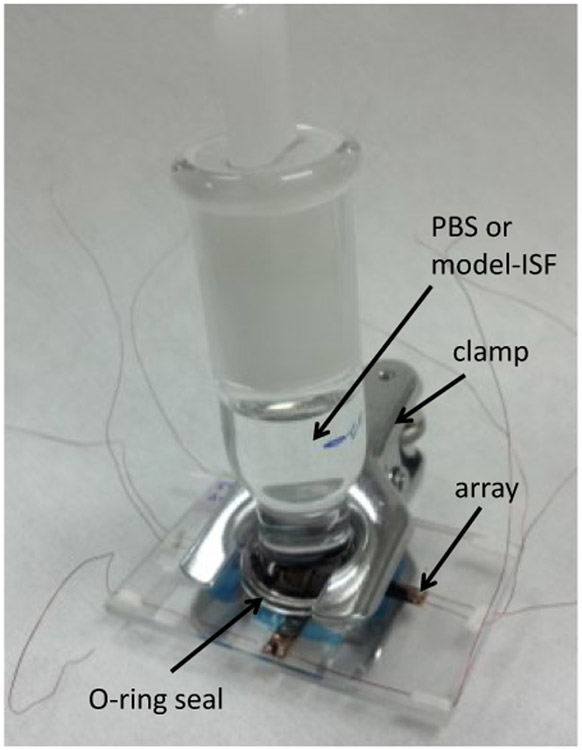
Electrochemical measurements were made in the cell shown in Fig. 3. The electrode array was placed on a glass slide and the electrode portion sealed with an o-ring seal to the 20/40 ground glass adapter. Electrical contact to the electrodes was made by bonding a wire to the contact pads with electrically conductive epoxy and over-coating with non-conductive epoxy to provide mechanical strength. For electrochemical measurements, the stopper was removed from the adapter and a Ag∣AgCl (3M KCl) reference electrode (Bioanalytical Systems) and large-area platinum foil counter electrode introduced into the cell. The SIROF electrodes were characterized electrochemically by cyclic voltammetry (CV) and electrochemical impedance spectroscopy (EIS). Two electrolytes were employed for the study: an Ar-deaerated, phosphate-buffered saline (PBS) having a composition of 126 mM NaCl, 22 mM NaH2PO4-7H2O and 81 mM Na2HPO4-H2O at pH 7.2-7.4, and an inorganic model of interstitial fluid (model-ISF) having a composition of NaCl 110 mM, NaHCO3 28 mM, KHCO3 7.5 mM, Na2HPO4-7H2O 2 mM, and 0.5 mM each of NaH2PO4-H2O, MgSO4, MgCl2, and CaCl2 [6, 7]. For the model-ISF, a pH of 7.4 was maintained by a gentle flow of 5%CO2/6%O2/89%N2 gas through the electrolyte. Measurements in PBS were made at room temperature, while measurements in model-ISF were made at 37°C. Prior to electrochemical measurements, all electrodes were subjected to a minimum of 10 hours of continuous slow sweep rate cyclic voltammetry (CV) in PBS between potential limits of −0.6 V and 0.8 V. This initial period of CV cycling is used to ensure that the SIROF is fully hydrated following thin-film fabrication which exposes the SIROF to a photoresist processing temperature of 110°C. The cathodal charge storage capacity (CSCc) of the SIROF was calculated as the time integral of the negative current during a full CV cycle at a sweep rate of 50 mV/s in model-ISF. The EIS measurements were made in model-ISF over a 0.05 – 105 Hz frequency range using a 10 mV rms sinusoidal excitation voltage. The CV and EIS measurements were made with a Gamry PC4 potentiostat using vendor supplied software.
Figure 3.
Experimental cell for electrochemical and voltage transient measurements. The cell is placed in an oven at 37°C when using model-ISF.
Voltage transients during current pulsing were measured in model-ISF with a custom-built Sigenics (Chicago, Ill) stimulator that provides monophasic cathodal pulses in which the potential of the electrode is actively controlled in the interpulse period. In the present study, measurements were made with the SIROF biased at 0.0 V (Ag∣AgCl). Charge-balance was obtained by reestablishing the interpulse bias using an anodic recharge current that was sufficient to establish the bias within a few milliseconds after the end of the cathodal current pulse. The stimulator is designed to limit the recharge current so that the electrode cannot be polarized more positively than the 0.8 V water oxidation limit observed with SIROF. A 1.9 ms delay was imposed between the end of the cathodal-current pulse and the anodic recharge phase to facilitate analysis of the electrode polarization. The electrode is at open-circuit in the interphase period and, with no imposed current, there is no ohmic or activation overpotential contribution to the measured potential. The maximum negative potential excursion (Emc) was taken as the potential at which the current becomes zero after the end of the cathodal current pulse. The time for the current to decay to zero was about 18 μs. The charge-injection capacity of the electrodes was calculated from the current necessary to polarize the electrode to an Emc of −0.6 V.
Data were analyzed with Stata/IC 12.1 (StataCorp, College Station TX). Slopes of regression analyses were considered significantly different from zero for p < 0.05.
III. Results
A. Cyclic Voltammetry
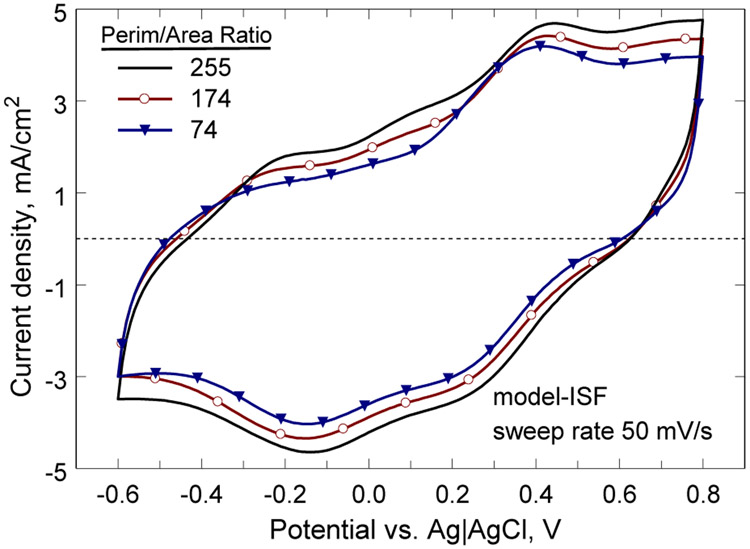
A comparison of the CV response of three electrodes in model-ISF is shown in Fig. 4. The CSCc of these electrodes was 82.5 mC/cm2 (B-6), 74.3 mC/cm2 (B-5) and 65.8 mC/cm2 (B-1), and shows a trend to higher CSCc with increasing perimeter-to-area ratio. A regression analysis for electrodes in the 0.0023 mm2 to 0.0031 mm2 GSA range is shown in Fig. 5. These electrodes showed a significant correlation between CSCc and perimeter-to-area ratio with a regression slope of 0.1 mC-mm/cm2 (95% CI 0.076 to 0.124, p<0.001, R2=0.76). As noted previously for SIROF electrodes, the electrochemical properties also depend of the GSA of the electrode and are most sensitive when the electrodes are small, <0.01 mm2. Regression of CSCc versus GSA for the same electrodes in Fig 5 was also highly correlated (p=0.001) with the CSCc increasing with GSA. This correlation is opposite from what would be expected based on electrolyte transport limitations and reflects the strong influence of perimeter-to-area ratio on the electrode properties. For this reason, we also compared the dependence of CSCc on perimeter-to-area ratio for two sets of electrodes within group B that have identical GSAs. The CSCc of electrodes with a GSA = 0.0029 mm2 and perimeter-to-area ratios of 137 (n=4) and 255 (n=4) were compared using an unpaired, two-tailed t-test and found to be significantly different with means of 73.0±3.7 mC/cm2 (mean±s.d.) and 83.8 mC/cm2 (mean±s.d.), respectively (p=009). Electrodes of the same GSA but a smaller difference in perimeter-to-area ratio (B-2 and B-3) did not have a statistically significant difference in CSCc (p=0.28). Group A electrodes with a GSA in the range 0.016 mm2 to 0.027 mm2 also exhibited a significant correlation between CSCc and perimeter-to-area ratio, but with a smaller slope (0.073 mC-mm/cm2) and a less robust fit (p=0.03, R2=0.21).
Figure 4.
Cathodal charge storage capacity at 50 mV/s for three electrodes with perimeter –to-area ratios of 255, 174, and 74. The GSA of the electrodes was 0.0029 mm2, 0.0031 mm2, and 0.0023 mm2, respectively.
Figure 5.
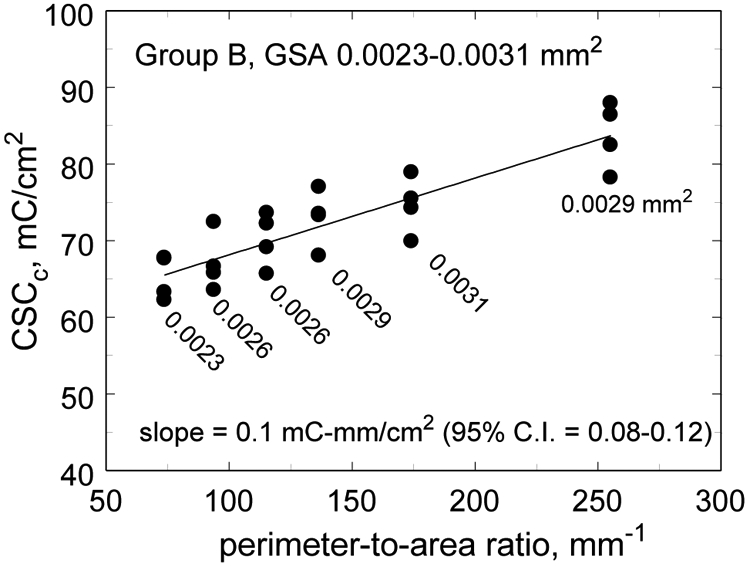
Regression plot of CSCc versus perimeter-to-area ratio. The GSA of the electrodes at each value of perimeter-to-area is indicated. The fit is significant, p<0.001.
B. Impedance
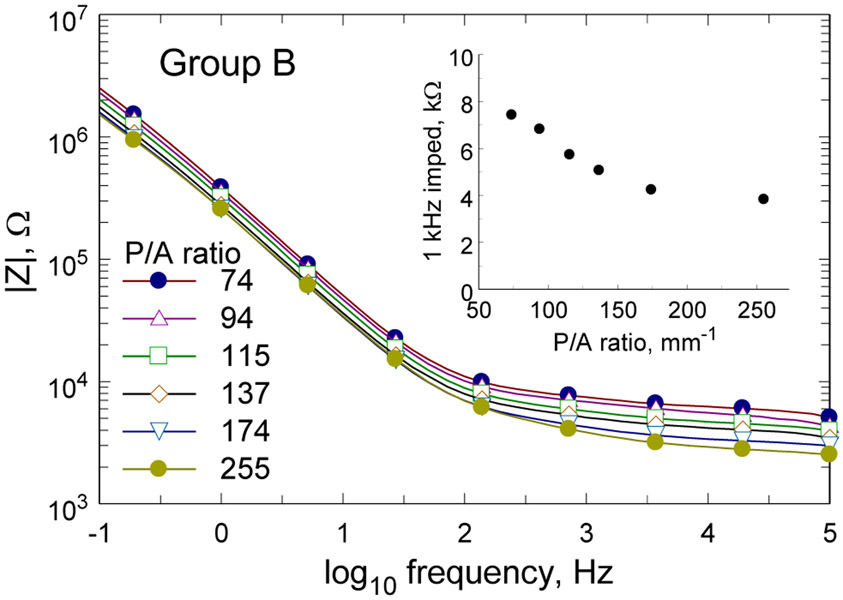
Impedance spectra of representative Group B electrodes from one array are shown in Fig. 6. As expected, the electrodes with larger perimeter-to-area ratio exhibit lower impedance across the full 0.1–105 Hz frequency range, although the differences were not great. The insert in Fig. 5 shows the 1 kHz impedance magnitude as a function of perimeter-to-area ratio for these electrodes. A similar dependence of impedance on perimeter-area ratio was observed for Group A electrodes with the 1 kHz impedance decreasing from 2.25±0.03 kΩ (mean±s.d., n=5) for a perimeter-to-area ratio of 28 mm−1 to 0.86±0.13 kΩ (mean±s.d., n=6) for a perimeter-to-area ratio of 164 mm−1.
Figure 6.
Impedance spectra of Group B electrodes from one array are shown for each perimeter-to-area ratio. The insert shows the 1 kHz impedance magnitude versus perimeter-to-area ratio.
C. Current Pulsing
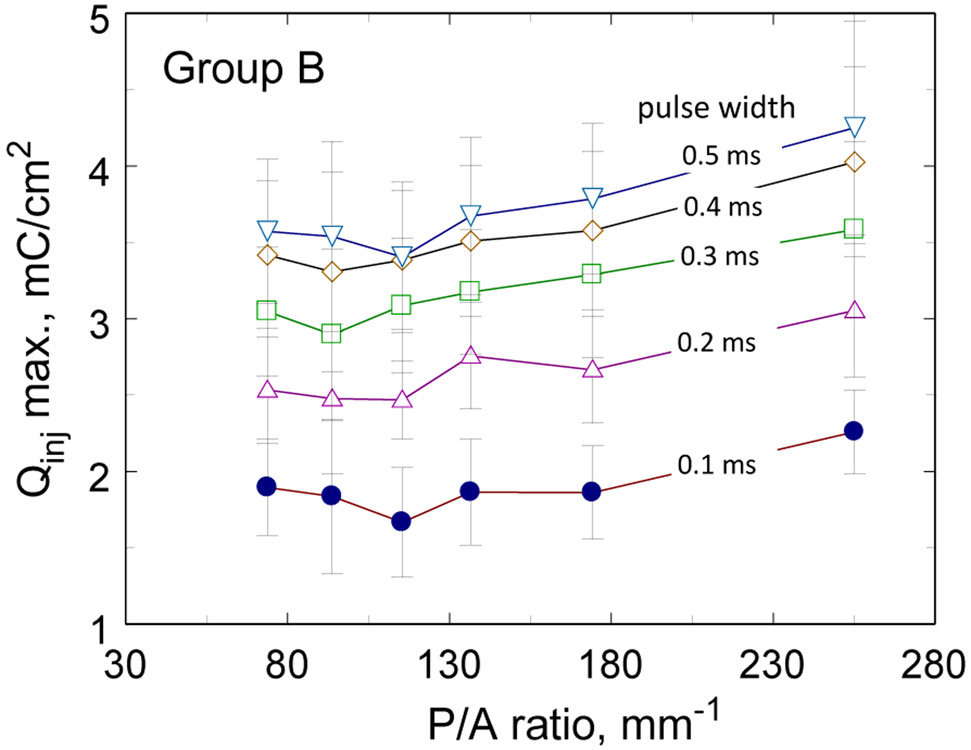
The charge-injection capacities of the Group B electrodes are shown in Fig. 7 as a function of perimeter-to-area ratio and pulse width from 0.1 ms to 0.5 ms. The data show the increase in charge-injection capacity obtained with longer pulse widths. Electrodes in Group B showed a tendency to higher charge-injection capacities at the largest perimeter-to-area ratio (255 mm−1). Regression fits were significant (p<0.05) at all pulse widths, but visual inspection of the data in Fig. 7 suggest that the increase in Qinj occurs primarily as the highest perimeter-to-area ratio and the relationship between Qinj and perimeter-to-area ratio is not linear. The effect of perimeter-to-area ratio for the Group A electrodes was not significant except for a pulse width of 0.1 ms with a linear regression slope of 0.002 mC-mm/cm2 (95% C.I. 0.001 – 0.003, p=0.004, R2=0.28, n=25).
Figure 7.
Charge-injection capacity of Group B SIROF electrodes (GSA = 0.0023 – 0.0031 mm2) as a function of pulse width and perimeter-to-area ratio. Error bars are ±1 s. d.
The maximum negative potential excursion (Emc) as a function of perimeter-to-area ratio is shown in Fig. 8 for Group B electrodes pulsed at 1 mC/cm2 with 0.1 ms and 0.4 ms pulse widths. There is trend to lower electrode polarization with increasing perimeter-to-area ratio for both pulse widths. The slopes of the regression lines are 0.0003 V-mm (95% CI=0.0002 – 0.0004, p<0.001, R2=0.49, n=28) and 0.0002 V-mm (95% CI=0.0001 – 0.0004, p=0.002, R2=0.29, n=28) for the 0.1 ms and 0.4 ms pulse widths, respectively.
Figure 8.
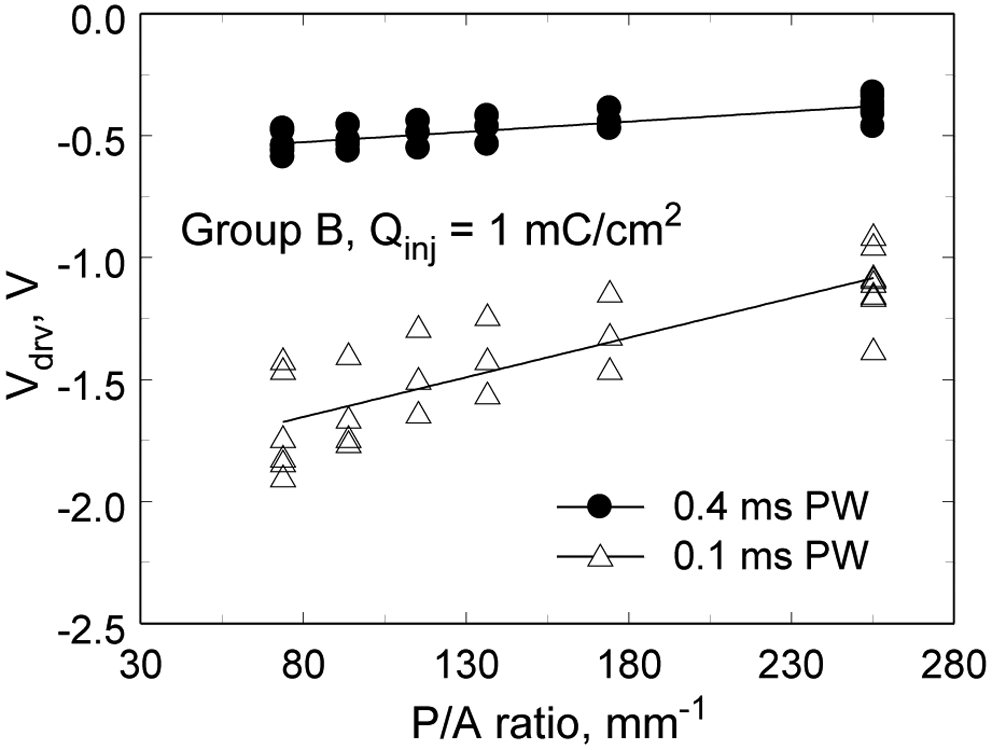
Maximum driving voltage (Vdrv) versus perimeter-to-area ratio for pulse widths of 0.1 ms and 0.4 ms measured for 1 mC/cm2 pulses. Regression line slopes are 0.0008 V-mm (95% CI=0.0006 – 0.001, p<0.001, R2=0.68, n=28) and 0.003 V-mm (95% CI=0.0024 – 0.0041, p<0.001, R2=0.70, n=28) for the 0.4 ms and 0.1 ms pulse widths, respectively.
IV. Discussion
The charge-injection properties of stimulation and recording electrodes are influenced by electrode shape. Electrodes with a higher perimeter-to-surface area ratio are expected to have a lower impedance and higher charge injection capacity due to both reduced ionic resistance of the electrolyte and a higher flux of counterions to the electrode during pulsing. Both these effects were evident for SIROF electrodes with a GSA in the range 0.0023 mm2 to 0.0031 mm2. However, the magnitude of the effect was modest. The charge-injection capacity as a function of pulse width for electrodes with a perimeter-to-area ratio of 94 and 255 in Group B is shown in Fig. 9. The increase in the average charge injection capacity for each pulse width varies from 21% to 26%. This increase in charge injection capacity required increasing the aspect ratio of these rectangular electrodes from 3.4 (P/A = 94) to 45 (P/A 255). The P/A=255 electrode has dimensions of 362 μm by 8 μm and it is uncertain how this highly asymmetric geometry will affect the stimulation and recording properties of the electrode. The larger area Group A electrodes showed no significant difference in Qinj with perimeter-to-area ratio electrodes with aspect ratios of 4.1 (P/A 37) and 184 (P/A 165).
Figure 9.
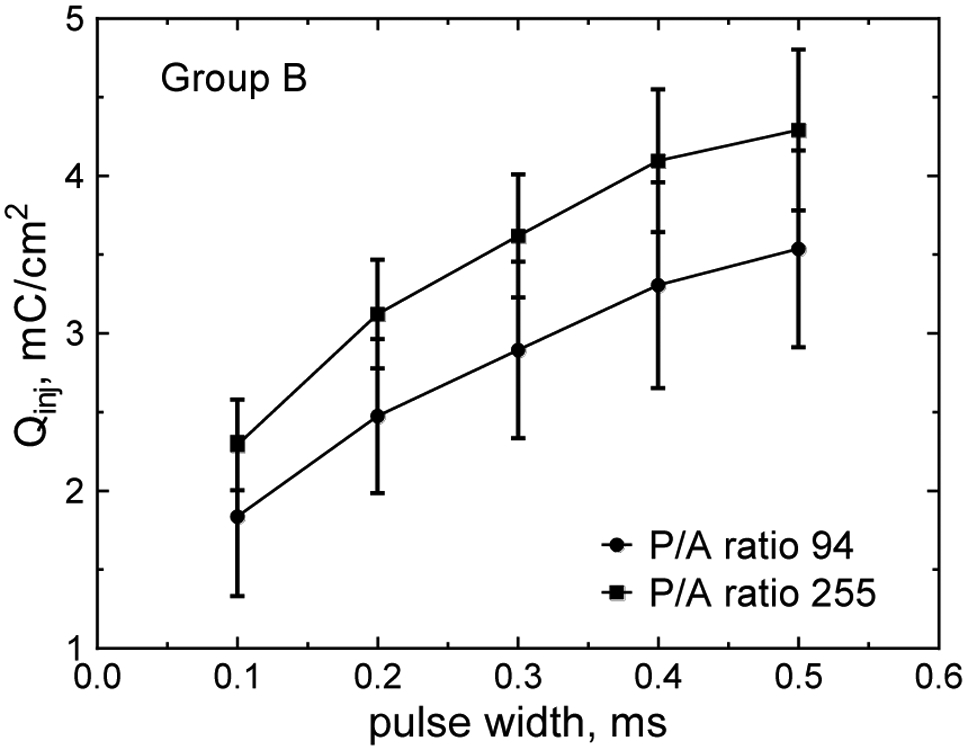
Charge injection capacity of Group B electrodes versus pulse width are compared for two extremes of P/A ratio investigated.
V. Conclusion
Studies in an inorganic model of interstitial fluid (model-ISF) suggest that improvements in the charge injection capacity of neural stimulation electrodes will be at best modest and only achieved with highly asymmetric microelectrodes having a GSA less than ~10,000 μm2. The major limitation of this study is the absence of tissue encapsulation and other physiological factors that affect ion transport and electrode impedance. The benefits of geometric asymmetry may be greater in a diffusionally more restricted environment.
Acknowledgments
Research supported by the National Institutes of Health under Grant No. R44NS066567-02 awarded by the NINDS. ABC Foundation.
Contributor Information
Stuart F. Cogan, EIC Laboratories, Norwood, MA 02062 USA.
Julia Ehrlich, EIC Laboratories, Norwood, MA 02062 USA.
Timothy D. Plante, EIC Laboratories, Norwood, MA 02062 USA
References
- [1].Wei XF and Grill WM, “Current density distributions, field distributions and impedance analysis of segmented deep brain stimulation electrodes,”J. Neural Eng, vol. 2, pp. 139–47, 2005. [DOI] [PubMed] [Google Scholar]
- [2].Wei XF and Grill WM, “Analysis of high-perimeter planar electrodes for efficient neural stimulation,” Front. Neuroeng, vol. 2, Article 15, pp. 1–10, 2009. [DOI] [PMC free article] [PubMed] [Google Scholar]
- [3].Grill WM and Xei XF, “High efficiency electrodes for deep brain stimulation, Conf. Proc. IEEE Eng. Med. Biol. Soc, vol. 2009, pp. 3298–301. 2009. [DOI] [PMC free article] [PubMed] [Google Scholar]
- [4].Cogan SF. Edell DJ, Guzelian AA, Ping LY, and Edell R. “Plasma-enhanced chemical vapor deposited silicon carbide as an implantable dielectric coating,” J. Biomed. Mater. Res. A, vol. 67, pp. 856–67. December 2003. [DOI] [PubMed] [Google Scholar]
- [5].Cogan SF, Ehrlich J, Plante TD, Smirnov A, Shire DB, Gingerich M, Rizzo JF, “Sputtered iridium oxide films for neural stimulation electrodes,” J. Biomed. Mater. Res., B Appl. Biomater, vol. 89 pp. 353–61. May 2009. [DOI] [PMC free article] [PubMed] [Google Scholar]
- [6].Selkurt EE, “Body water and electrolyte composition and their regulation,” in Physiology, 3rd ed., Selkurt EE, Ed. Boston: Little, Brown & Company, 1971, pp. 529–534. [Google Scholar]
- [7].Cogan SF, Troyk PR, Ehrlich J, Gassbaro CM, and Plante TD, “The influence of electrolyte composition on the in vitro charge-injection limits of activated iridium oxide (AIROF) stimulation electrodes,” J. Neural Eng, vol. 4, pp. 79–86, June 2007. [DOI] [PubMed] [Google Scholar]


