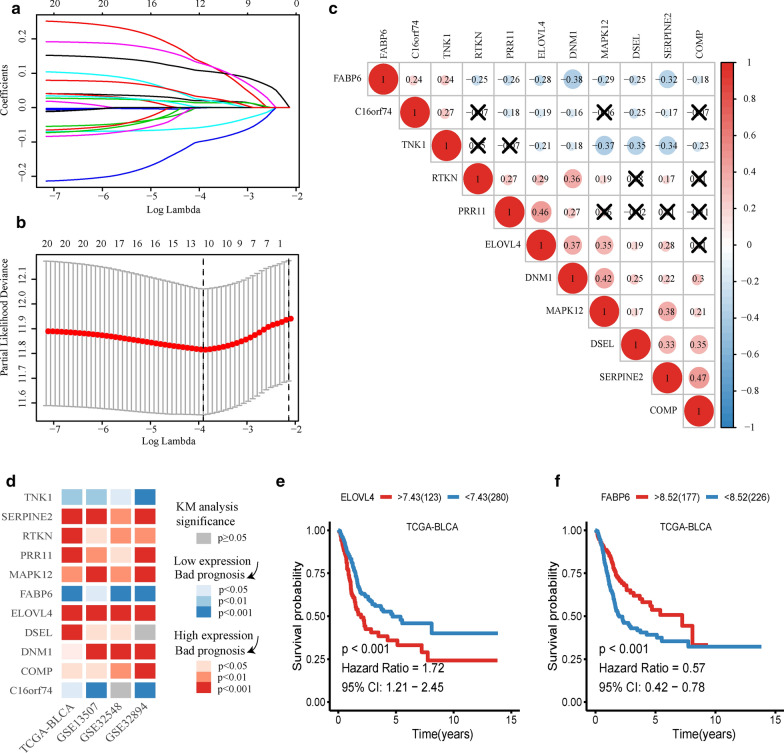
Fig. 2.
Lasso Cox and Kaplan–Meier analysis. a Lines of different colors represent different genes. With the increase of lambda value, the coef of some genes become zero, indicating that they do not affect the model. b The deviance of the cross validation. When the partial likelihood deviance is minimum, the corresponding model is the best. c The co-expression heat map of 11 genes. Red indicates a positive correlation, blue indicates a negative correlation, and the cross indicates no statistical significance. d The heatmap of Kaplan–Meier analysis results of 11 genes. Red means high expression of the gene lead to worse prognosis, blue means low expression of the gene lead to worse prognosis, grey means there are no significance of the analysis, p < 0.05 means it is statistically significant. The darker of the color shows the smaller of the p-value. e Kaplan–Meier analysis of ELOVL4 in TCGA-BLCA. f Kaplan–Meier analysis of FABP6 in TCGA-BLCA

