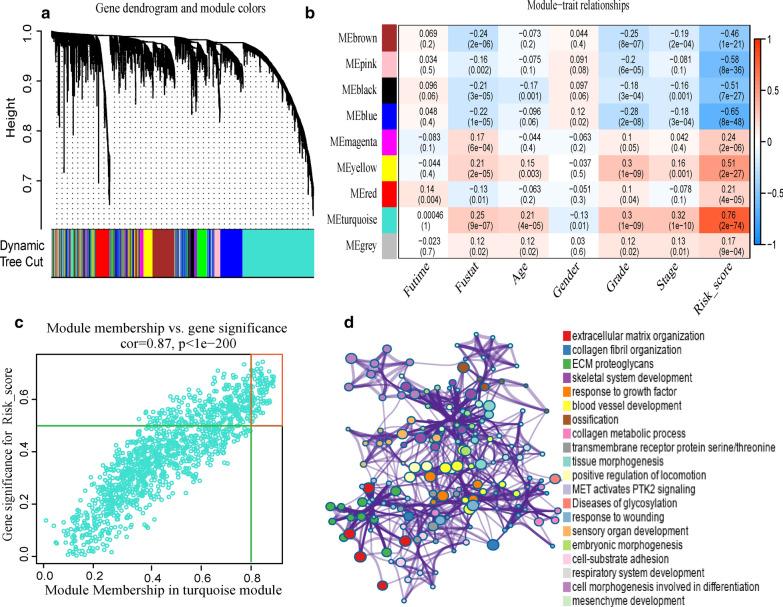
Fig. 5.
Weighted co-expression network and enrichment analysis. a Genes were divided into different modules according to the dynamic cutting tree method, and different colors represent different modules. b The heatmap of the correlation between the gene module and clinical traits, p < 0.05 indicates statistical significance. c Gene significance and module membership scatter diagrams of the turquoise module. The dots in the red box are represented as key genes. d The left side of the picture shows the interaction network map of enriched proteins, and the same color indicates the same enrichment. The right side of picture shows the enriched terms decreasing from top to bottom by the significance of enrichment

