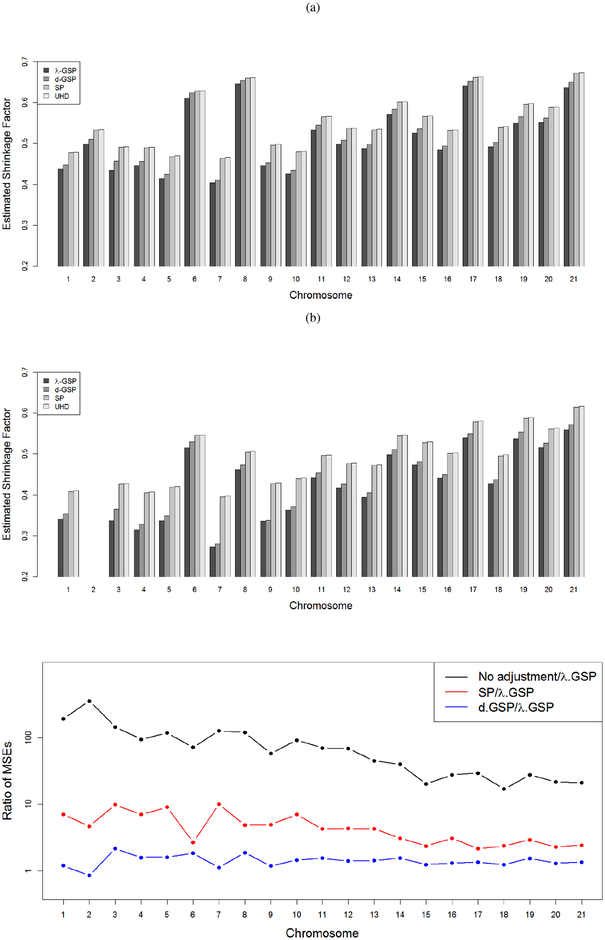
Figure 5:
Estimated shrinkage factors for (a) PC1 and (b) PC2 across chromosomes 1–21 based on three different methods. (c) Comparison of the mean squared errors (MSE) of the unadjusted and adjusted PC scores based on the d-GSP and SP methods with the adjusted PC scores based on the λ-GSP method. The ratios of the MSEs are presented for chromosome 1–21 using the threshold ϵ = 1. The y-axis is presented in a logarithmic scale.

