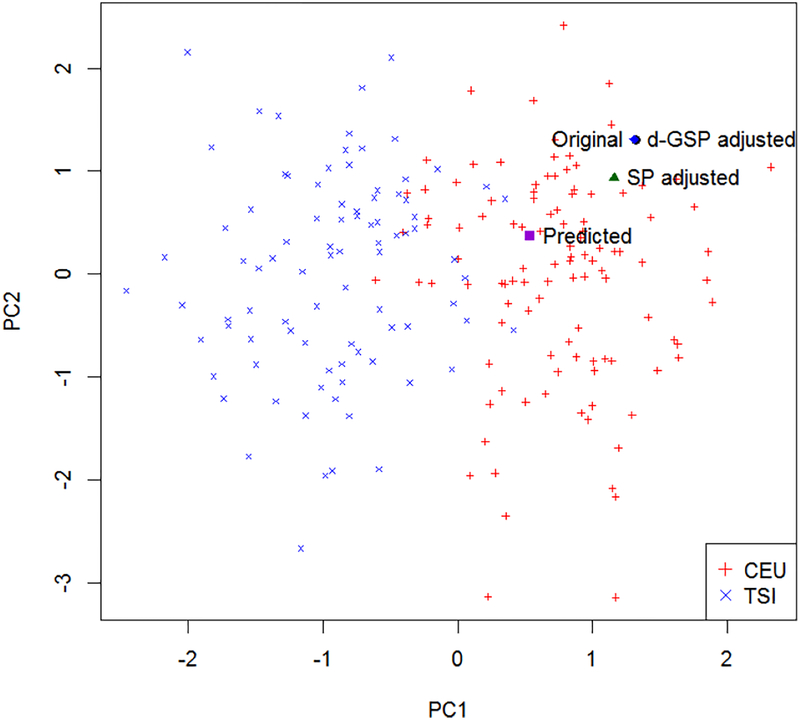
Figure 6:
PCl vs PC2 plot of the Hapmap III CEU and TSI samples based on chromosome 7. The predicted PC scores for the illustrative individual, and its bias-adjusted PC scores are also presented. Since the d-GSP and the λ-GSP adjusted scores are nearly the same, the λ-GSP adjusted scores are not presented.

