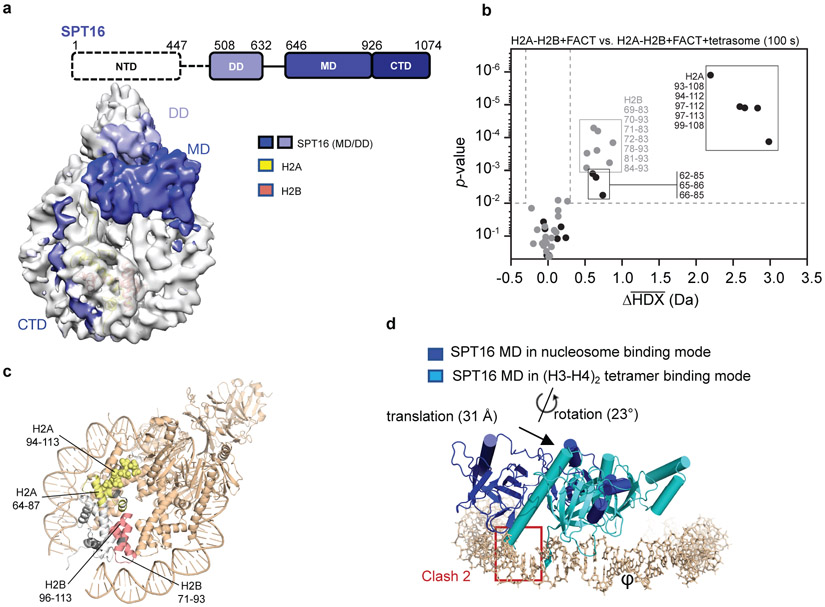
Figure 3: SPT16 interactions with the sub-nucleosome.
a. All visible domains of SPT16 interact extensively with the sub-nucleosome. The SPT16 CTD occupies the H2A-H2B DNA-binding surface.
b. Volcano plot comparing average HDX of H2A-H2B with FACT and H2A-H2B with FACT and tetrasomes at 100 s exchange. Data was collected in triplicate (n=3) and the Welch's t-test was one-sided. Dotted lines show significance cut-offs of Δ average HDX>0.3 Da and p-value<0.01 from a Welch’s t-test. Peptides from H2A are black and peptides from H2B are grey. Significant peptides are listed.
c. Regions of significant Δ average HDX (from part b) mapped onto H2A-H2B from complex 1. Parts of the docking domain are shown in space filling mode. For H2A-H2B, regions with change are yellow (H2A) and red (H2B); regions with no peptide coverage are grey. FACT and tetrasome are shown in wheat.
d. Comparison of SPT16 MD in complex 1, and bound to (H3-H4)2 (4Z2M). Only DNA and SPT16 MD from complex 1 are shown; the two structures were aligned based on the (H3-H4)2 tetramer (RMSD <0.1 Å).

