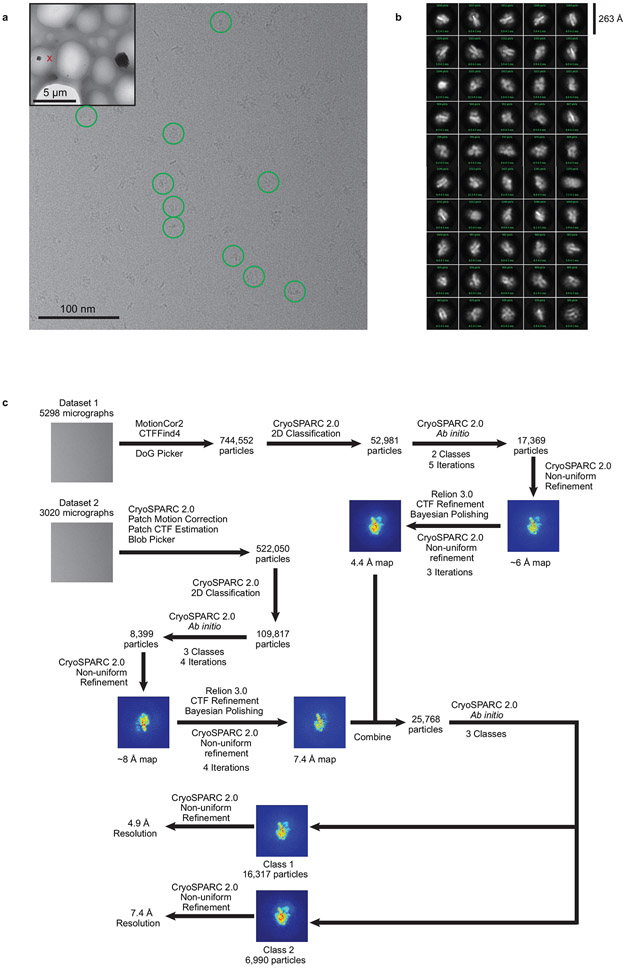
Extended Data Figure 1: EM data analysis.
a. Representative micrograph. Inset is a lower magnification view showing the holy substrate. The particles in the final picking were highlighted by the green circles. This experiment was repeated with 6 independent grids in two Krios sessions, with similar results.
b. 2D class averages generated from the dataset obtained from CryoSPARC 2.0.
c. Data processing strategy flow chart.

