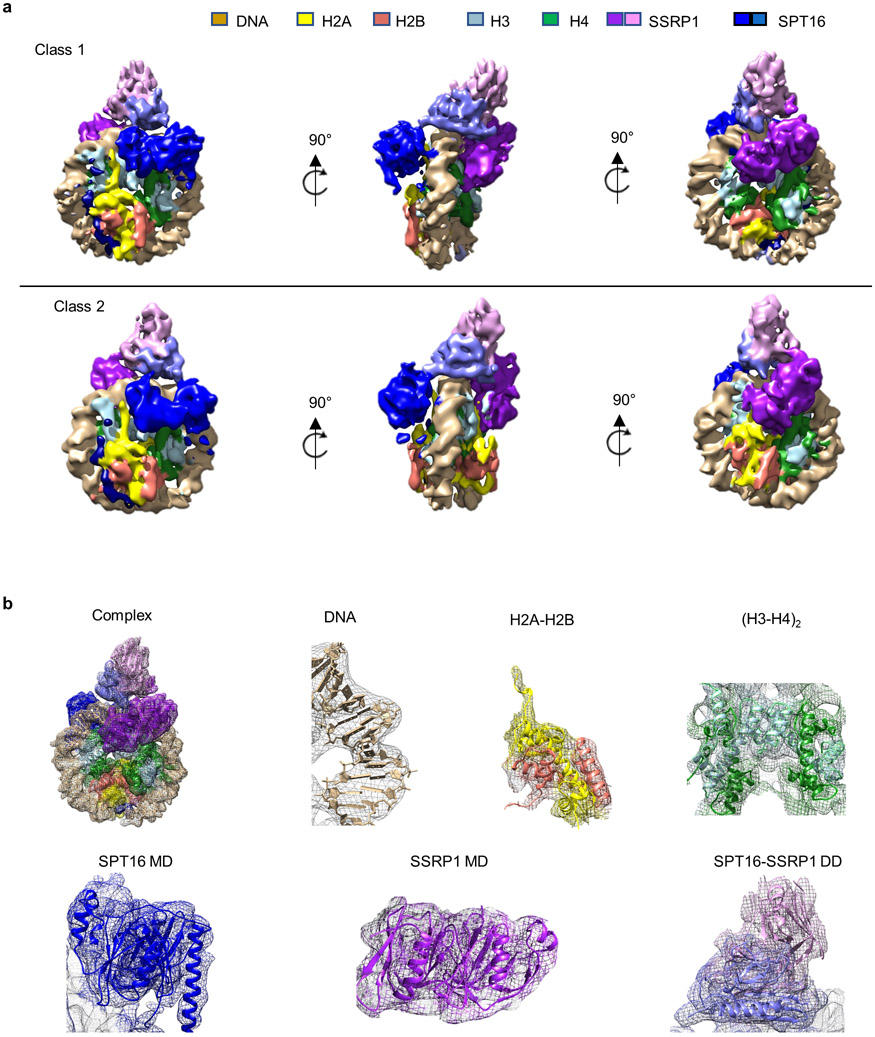
Extended Data Figure 3: Electron density and models.
a. Density maps of class 1 (top panel) and class 2 (bottom panel) in three orthogonal orientations. Color coding of subunits and domains as indicated.
b. Representative views of model fit into electron density maps for FACT-sub-nucleosome complex 1, DNA, H2A-H2B, (H3-H4)2, SPT16 MD, SSRP1 MD and SPT16-SSRP1 DDs.

