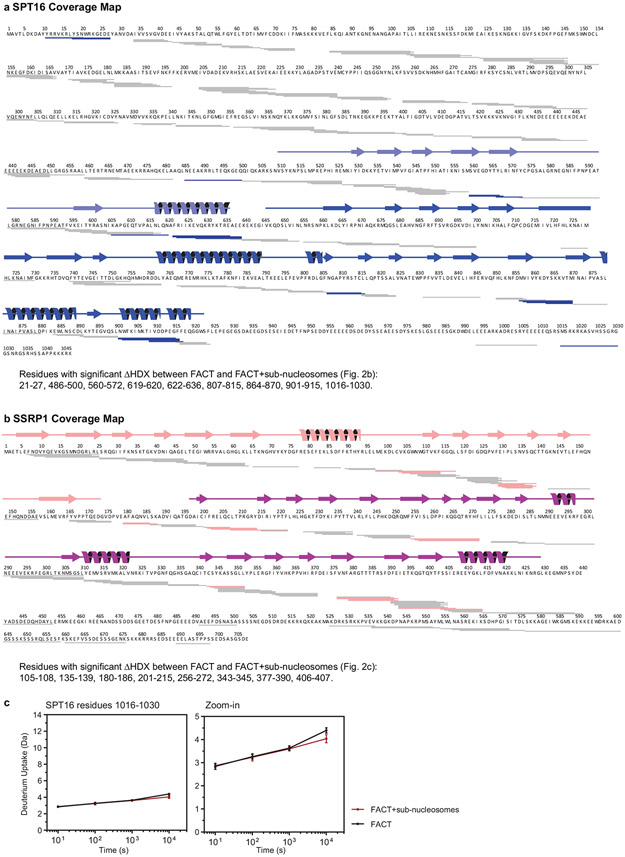
Extended Data Figure 4: Coverage maps of FACT HDX experiments.
a. and b. SPT16 and SSRP1 coverage maps from HDX experiments. Each rectangle is one peptide repeatably monitored through all time points and samples. Significant peptides (see Fig. 2b) are colored and listed. Secondary structure elements from the structures of the published domains that were used for fitting are shown.
c. Deuterium uptake plot for SPT16 residues 1016-1030 showing FACT (black) and FACT with sub-nucleosomes (red). Each data point is the average of three replicates with error bars of ±2 standard deviations.

