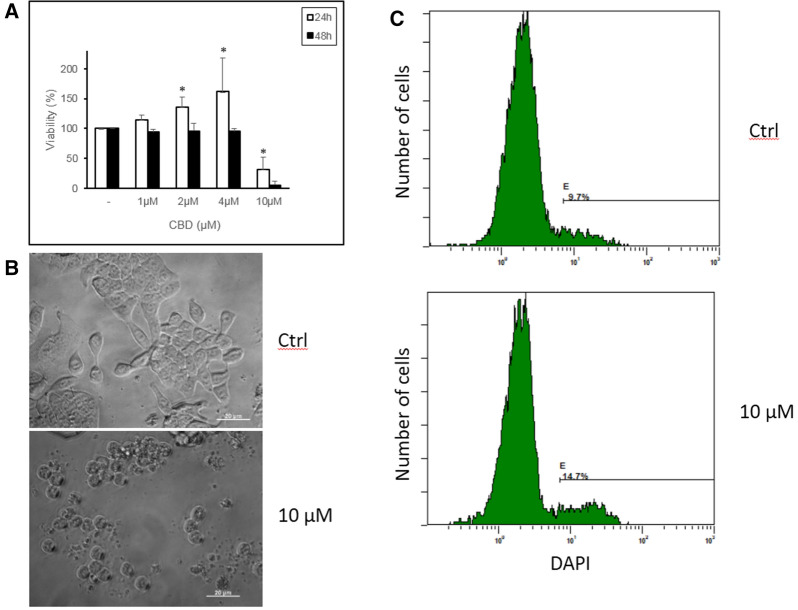
Fig. 1.
a HT-29 cells were incubated with 0.5% FCS and different concentrations of CBD for 24 and 48 h. Cell viability was assessed by incubation with AB. The mean + SD of three assays are shown. b Morphology of HT-29 cells incubated with or without 10 μM CBD for 24 h. Representative images are shown (bar, 20 µm). c HT-29 cell viability according to DAPI staining (see the “Materials and methods” section). HT-29 cells were incubated without (top) or with 10 μM CBD (bottom) for 24 h, stained with DAPI and immediately analyzed by flow cytometry. The cursor identifies DAPI-positive cells (dead cells), showing a higher percentage in CBD-treated cells. A representative experiment (c) is shown. *p < 0.05

