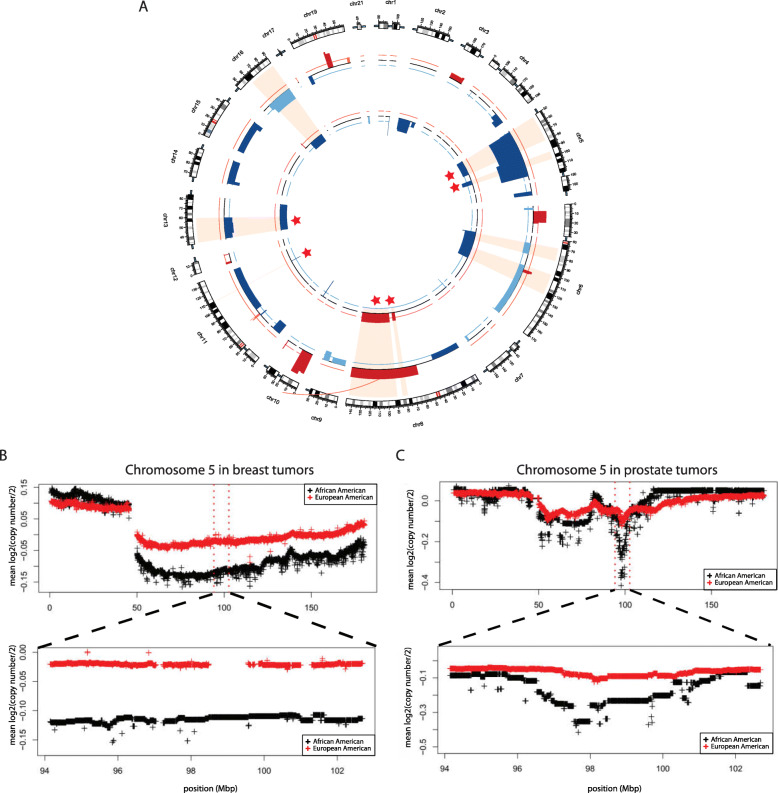
Fig. 2.
Race-differentiated SCNAs identified in TCGA breast and prostate tumors. a Circos plot of all race-differentiated SCNAs (p < 0.1) identified in TCGA breast (outer circle) and prostate (inner circle) tumors. The red color indicates SCNAs with higher magnitude amplification in African Americans (AAs), and the orange color indicates SCNAs with higher magnitude amplification in European Americans (EAs). The dark blue color indicates SCNAs with higher magnitude deletions in AAs, while the light blue shows SCNAs with higher magnitude deletions in EAs. The nine shaded regions indicate alterations that exists in both tumor types. Among those nine, the six SCNAs with consistent differences by race across tumor types are indicated by stars. As an example of one consistent region, average log2 (copy number/2) profiles on chromosome 5 were plotted for each race in b breast and c prostate tumors. For each tumor type, the top panel corresponds to the complete chromosome 5 profile, and the lower panel corresponds to chromosome 5q15–21.1, where the actual boundaries are from the prostate tumor SCNA

