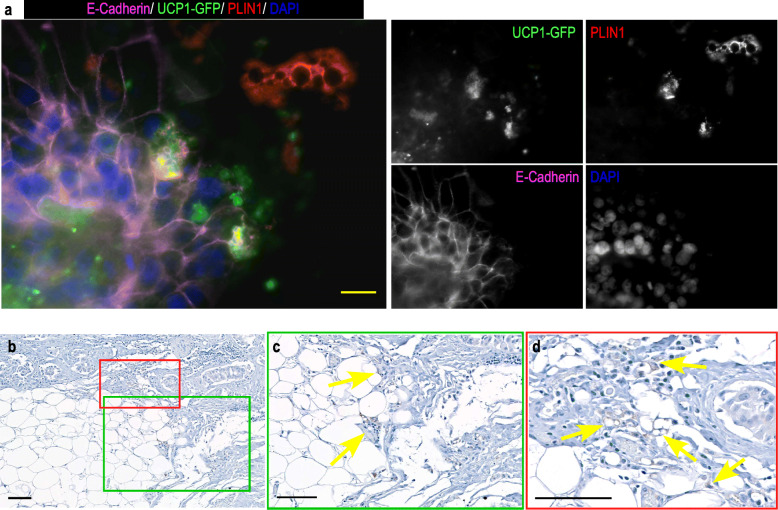
Fig. 2.
UCP1 expression in adipocytes close to tumor cells. a / MCF7 cells were grown as mammospheres for 7 days. They were co-cultured on a monolayer of hMADS cells expressing GFP under the control of UCP1 promoter which had been differentiated for 14 days. Co-culture of the 2 cell types lasted for 4 days. PLIN1 (red, labelling the lipid droplets) and E-Cadherin (pink, labelling the MCF7 mammospheres) expressions were visualized using specific antibodies. GFP expression was visualized in green. DAPI was used to label the nuclei (Blue). The fluorescence recorded for each channel is shown in separated images. The adipocytes adjacent to the mammospheres express both GFP and PLIN1, while those more distant from the mammospheres express PLIN1 only. Magnification 40X, scale bar 20 μM. b, and insets c & d UCP1 expression in patient breast tumor sections was detected using immunohistochemical labeling with anti-UCP1 antibody (arrows). The immunostains are shown in brown. Red and green frames are used to localize UCP1 expression in the section. Magnification 10X (b), 20X (c) & 40X (d), scale bar 100 μM

