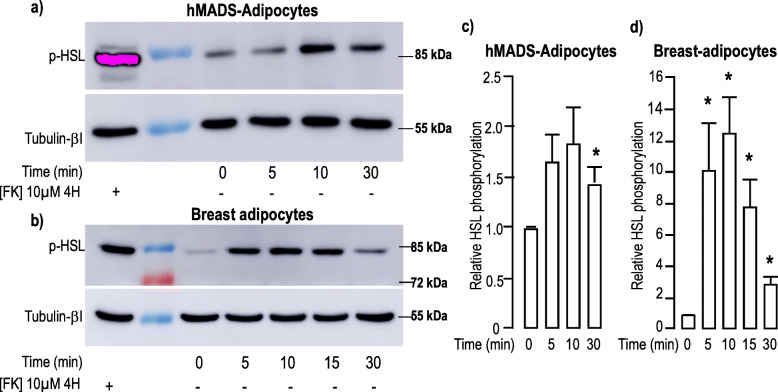
Fig. 5.
ADM induced phosphorylation of HSL. a-b, ADM increased phosphorylation of HSL. Protein expression and phosphorylation were measured in hMADS-adipocytes (panel a) or breast adipocytes (panel b) grown in the differentiation medium. They were stimulated with 100 nM ADM for the indicated time. Expressions of pHSL (upper panel) and Tubulin-βI (lower panel) used as a loading control were analyzed by Western blot using specific antibodies. A positive control condition with cells stimulated for 4 h with forskolin is shown. Representative Western blots are shown. Full-length blots are presented in Supplementary Figure 9. c-d, Quantification of the signals. Expression and phosphorylation of the proteins were quantified using the Quantity One Program and compared to the expression of Tubulin-βI. The means ± SEM were calculated from four independent experiments. (*p < 0.05)

