
Fig. 2.
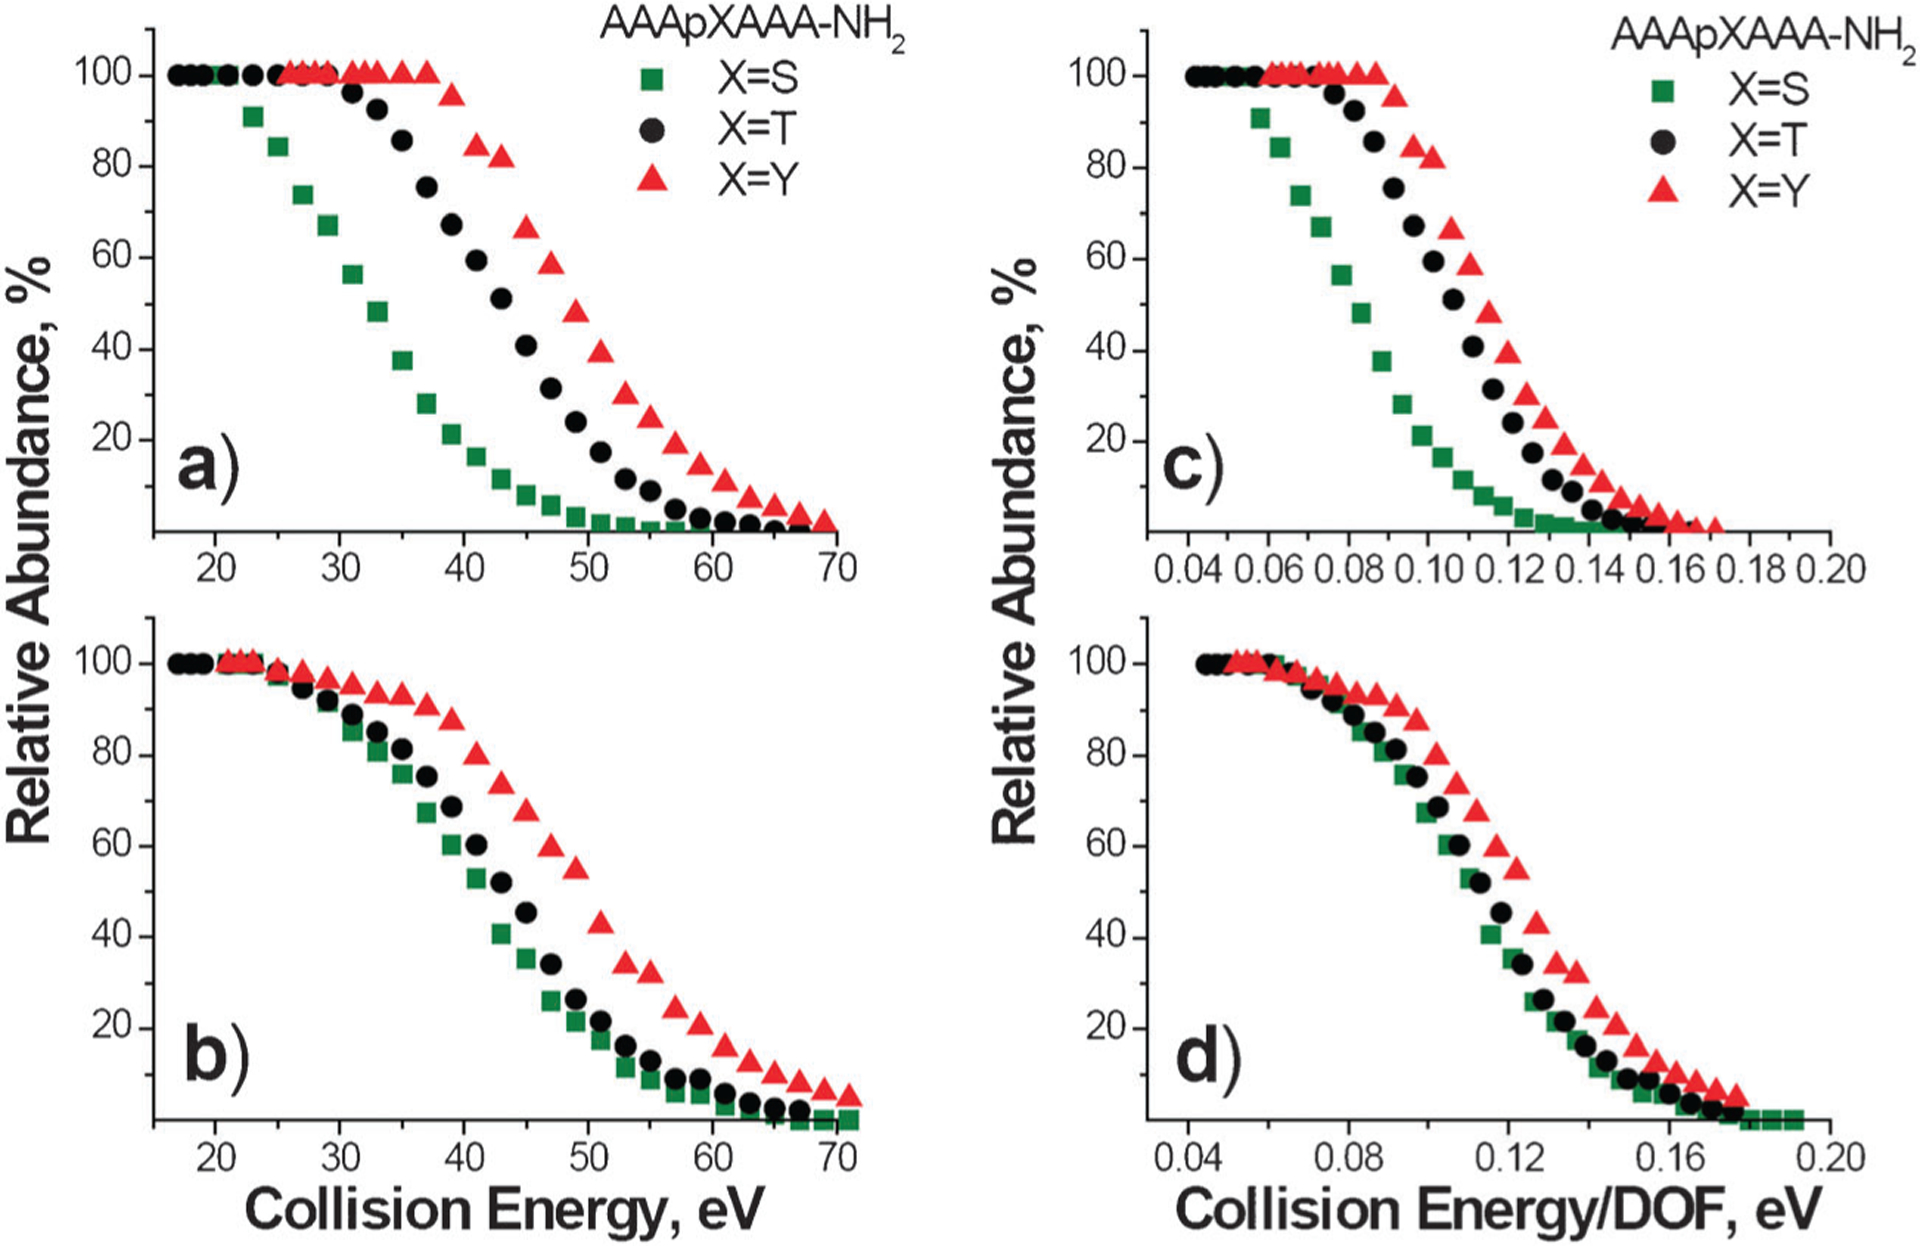
Survival curves obtained at a reaction delay of 1 s plotted as a function of collision energy (left panels) and collision energy scaled by the number of vibrational degrees of freedom, DOF, (right panels) for DCM–A3pXA3-NH2 complexes (a, c) and DGD–A3pXA3-NH2 complexes (b, d). The green squares correspond to X = S, black circles correspond to X = T, and red triangles correspond to X = Y.