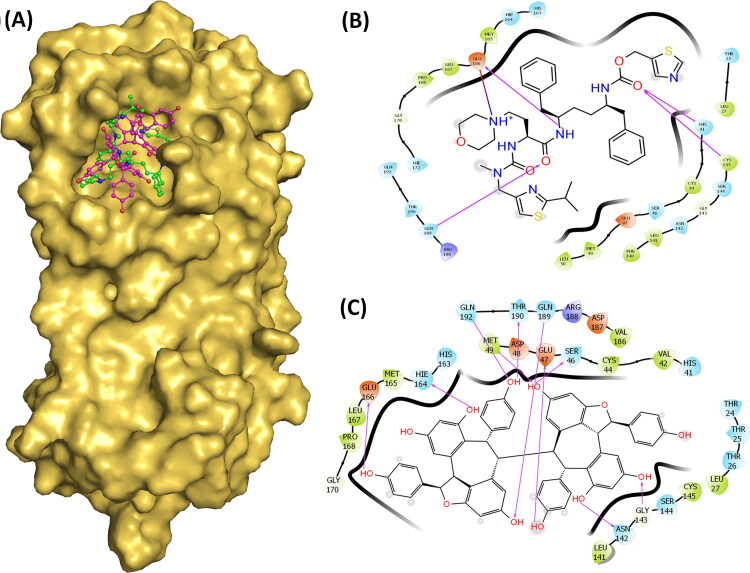
Figure 3.
(A) Surface diagram showing the position of Cobicistat and Hopeaphenol in the active site. (B) Ligand interaction diagram showing hydrogen and hydrophobic interactions of Cobicistat with Mpro. (C) Ligand interaction diagram showing hydrogen and hydrophobic interactions of Hopeaphenol with Mpro.

