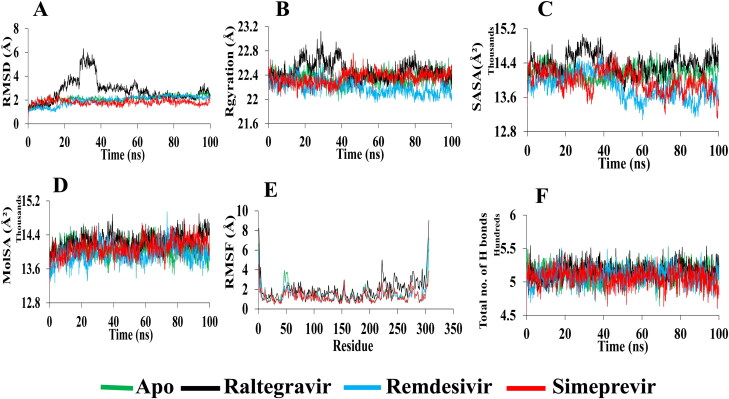
Figure 6.
Analysis of 100 ns MD simulation of Mpro in complex with selected drugs. (A) Root mean square deviation values of C-α atom of Mpro in the complexes with selected drugs along the 100 ns MD simulations. The structural changes of Mpro by means of (B) radius of gyration, (C) solvent accessible surface area, (D) molecular surface area, (E) root means square fluctuations, and (F) total number of hydrogen bonds formed during the simulation.

