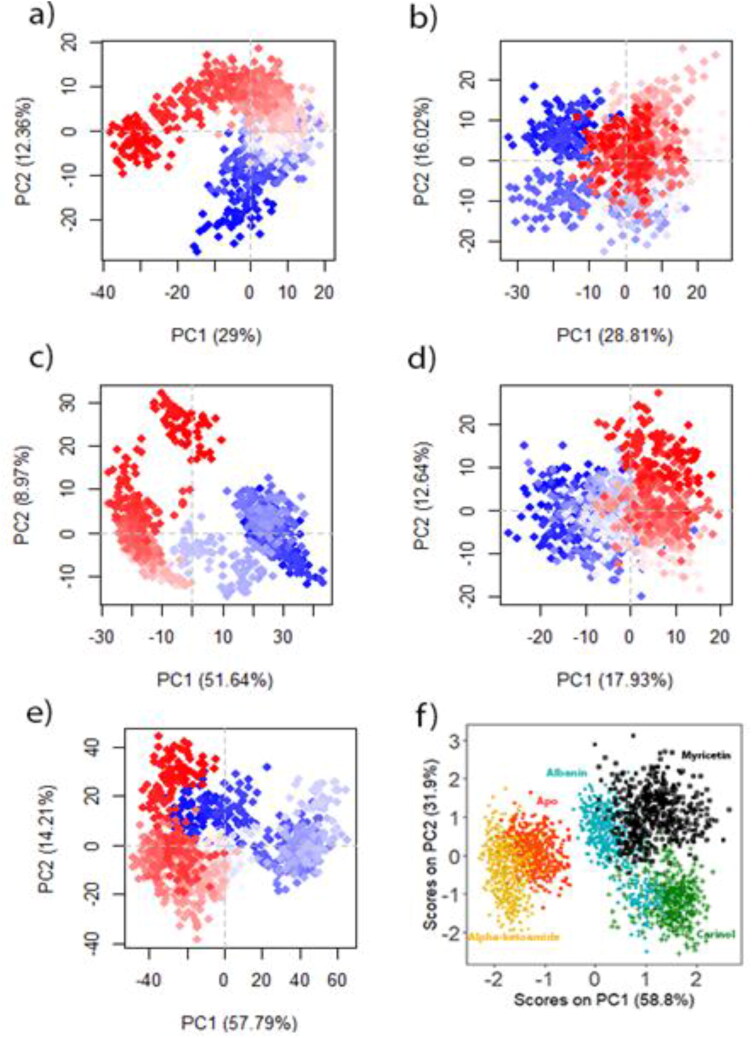
Figure 3.
Principle component analysis of (a) Apo, (b) Alpha ketoamide-Mpro complex, (c) Carinol-Mpro complex, (d) Albanin-Mpro complex and (e) Myricetin-Mpro complex. Each dot denotes its conformation of the protein throughout the X and Y axis. The spread of blue and red color dots described the degree of conformational changes in the simulation, where the color spectrum from blue to white to red is equivalent to simulation time. The blue specifies the initial timestep, white specifies intermediate, and the final timestep is represented by red color. (f) PCA of trajectory data (RMSD, Rg and SASA) of all systems.

