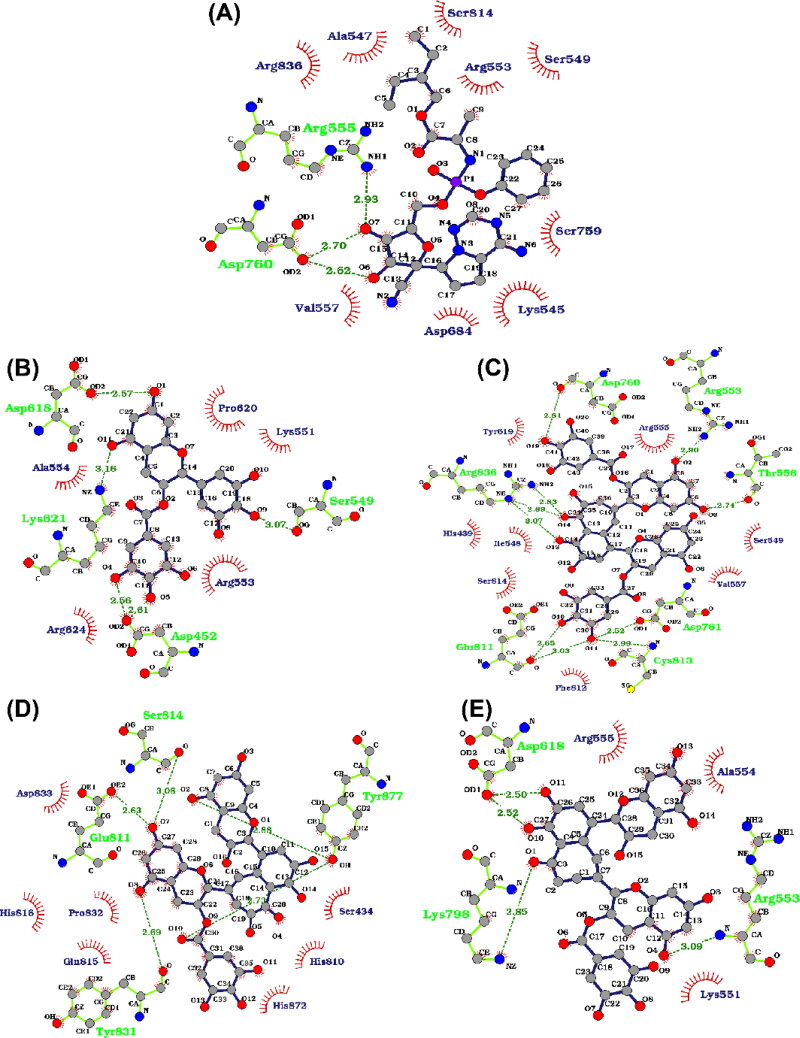
Figure 7.
The RdRp-ligands interaction profile for (A) RdRp/remdesivir, (B) RdRp/EGCG, (C) RdRp/TF3, (D) RdRp/TF2b and (E) RdRp/TF2a. The polyphenols and remdesivir are shown in balls and sticks. Hydrogen bonds are depicted in green dotted lines, and red semicircles residues are involved in hydrophobic interactions.

