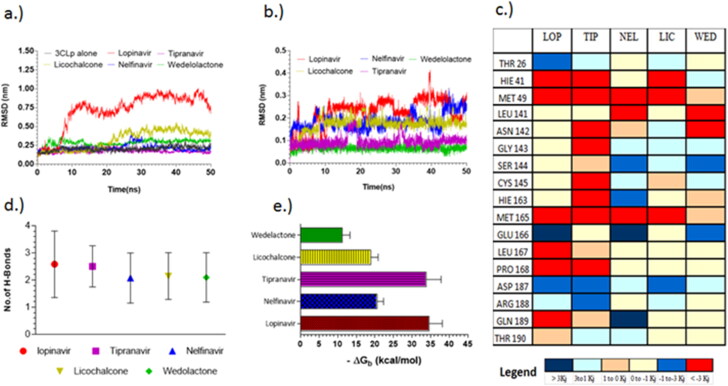
Figure 4.
Molecular dynamic simulations of selected final candidates against 3CLp (a) RMSD plot; (b) RMSD plot of ligand backbone (vs.) protein backbone; (c) average energy per residue plot indicating the energies of interacting residue of lopinavir (LOP), tipranavir (TIP), nelfinavir (NEL), licochalcone (LIC) and, wedelolactone (WED); (d) average of H-bonds throughout the trajectory of 3CLp complexes; (e) binding energy of 3CLp complexes obtained from MM-PBSA post-convergence.

