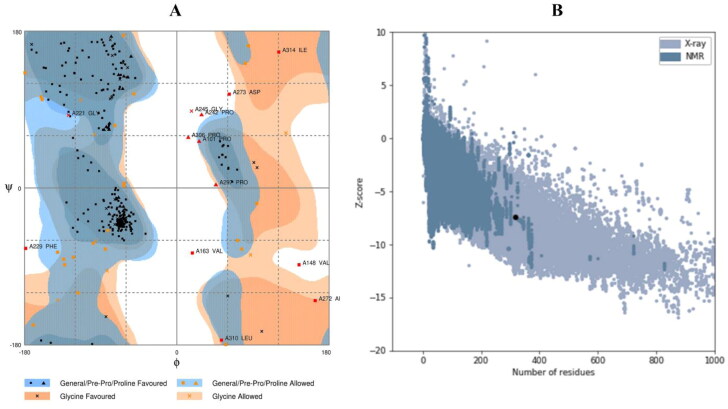
Figure 6.
Validation of the tertiary structure of the vaccine. (A) The Ramachandran plot statistics represent the most favorable, accepted, and disallowed regions with a percentage of 86.3, 9.6, and 4.1%, respectively, and (B) The ProSA-web representing the Z-score of –7.4 for the refined vaccine model.

