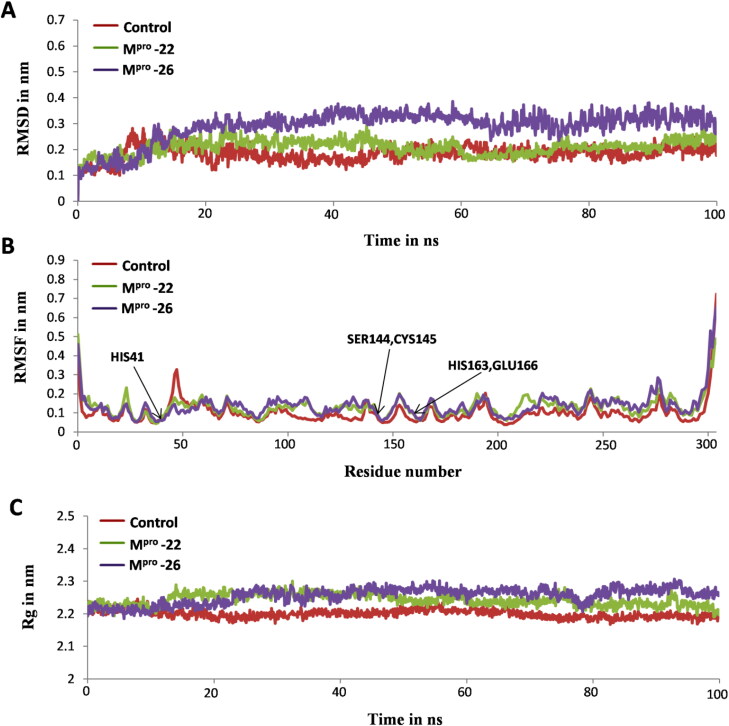
Figure 8.
Analysis of MD simulation trajectories for control and docked complexes in terms of root mean square deviations (RMSD), root mean square fluctuations (RMSF), and radius of gyration (Rg). (A) Backbone RMSDs of Mpro-X77 (control), Mpro-22 and Mpro-26 systems for 100 ns simulation time. (B) RMSF plot of Cα atoms from Mpro receptor structure in presence of X77 (control), 22 and 26 inhibitor molecules (C) Rg of Mpro receptor protein in presence of X77 (control), 22 and 26 inhibitor molecules for 100 ns showing similarity in compactness of SARS-CoV-2 Mpro protein.

