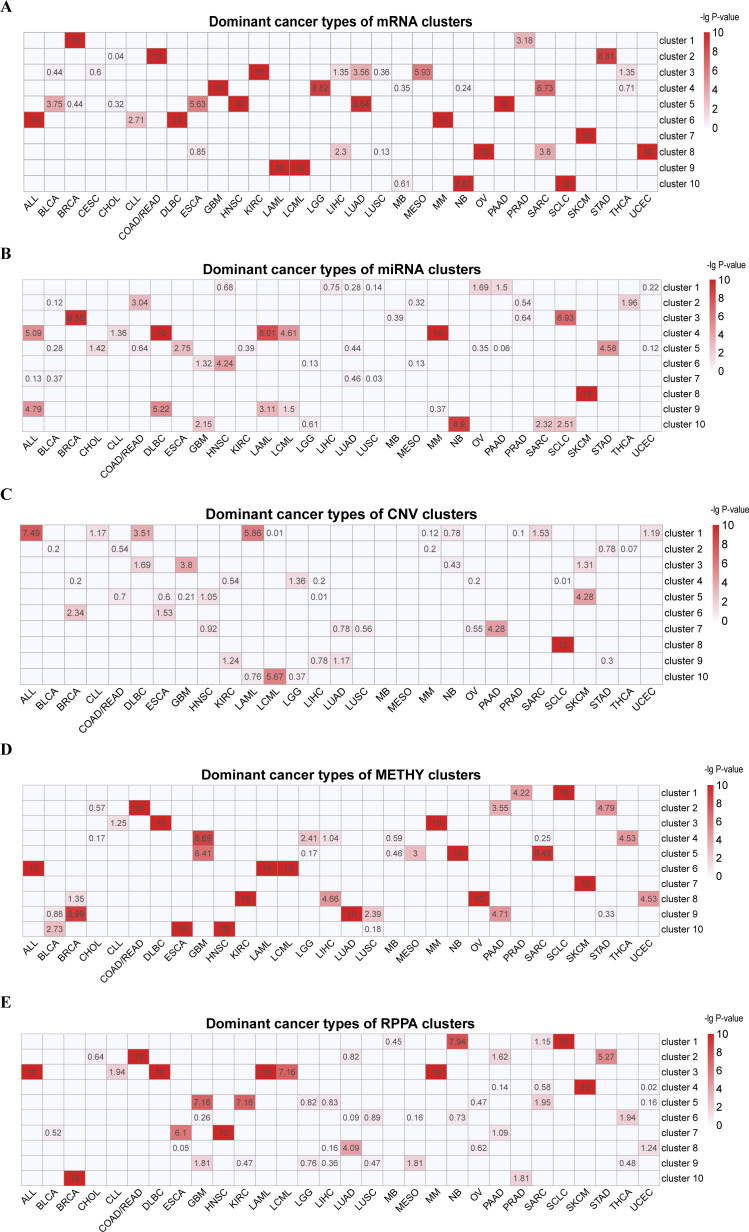
Figure 1. Cluster labels of single omics clustering.
(A) mRNA. (B) miRNA. (C) CNV. (D) METHY. (E) RPPA. A hypergeometric distribution was used to calculate the P-value for cancer types in each cluster. The rows represent clusters, and the columns represent cancer types. The values represent the −lg(P-value) of cancer types. Cancer types with −lg(P-value) > 3 in each cluster were defined as dominant cancer types. All the blank cells mean the instances of P-value = 0.

