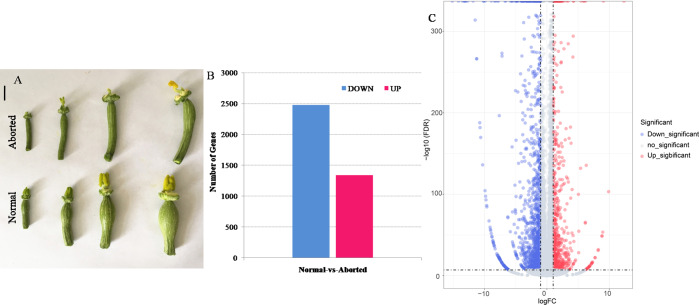
Figure 1. The aborted and normal pistils and differentially expressed genes (DEGs) that were significantly upregulated and downregulated between the aborted and normal pistils of pumpkin.
(A) The aborted and normal pistils (bars = 1 cm). (B) The number of upregulated and downregulated DEGs. (C) Volcano map for the gene expression. The —log2 (fold change)— > 1 and FDR <0.05 were used as the cut-offs for significance.

