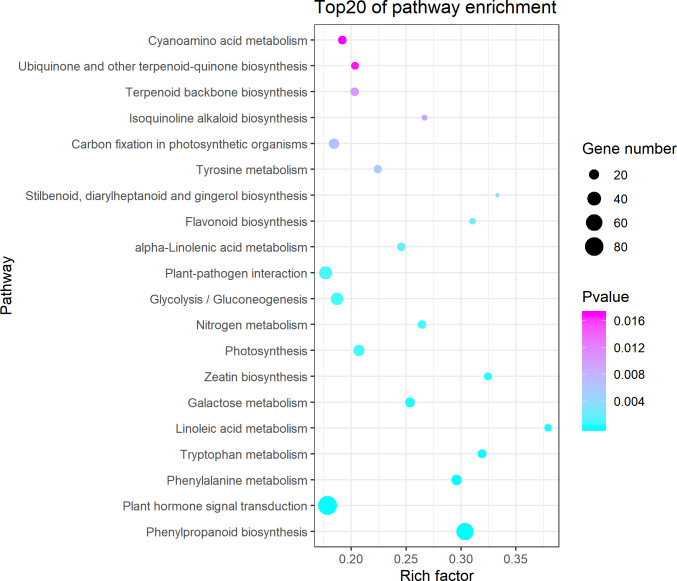
Figure 3. Kyoto Encyclopedia of Genes and Genomes (KEGG) pathway enrichment of differentially expressed genes (DEGs) between the aborted and normal pistils.
Ggplot2 package for R language was used to generate this figure. The bigger the bubble, the more the DEGs. The smaller the pvalue, the more significant the KEGG enrichment. Rich Factor represents the ratio of DEGs number in the pathway to the total number of genes in the pathway. The larger the RichFactor, the higher the enrichment.

